Guyanese vs Immigrants from Nigeria Median Male Earnings
COMPARE
Guyanese
Immigrants from Nigeria
Median Male Earnings
Median Male Earnings Comparison
Guyanese
Immigrants from Nigeria
$50,613
MEDIAN MALE EARNINGS
2.2/ 100
METRIC RATING
242nd/ 347
METRIC RANK
$51,310
MEDIAN MALE EARNINGS
4.2/ 100
METRIC RATING
230th/ 347
METRIC RANK
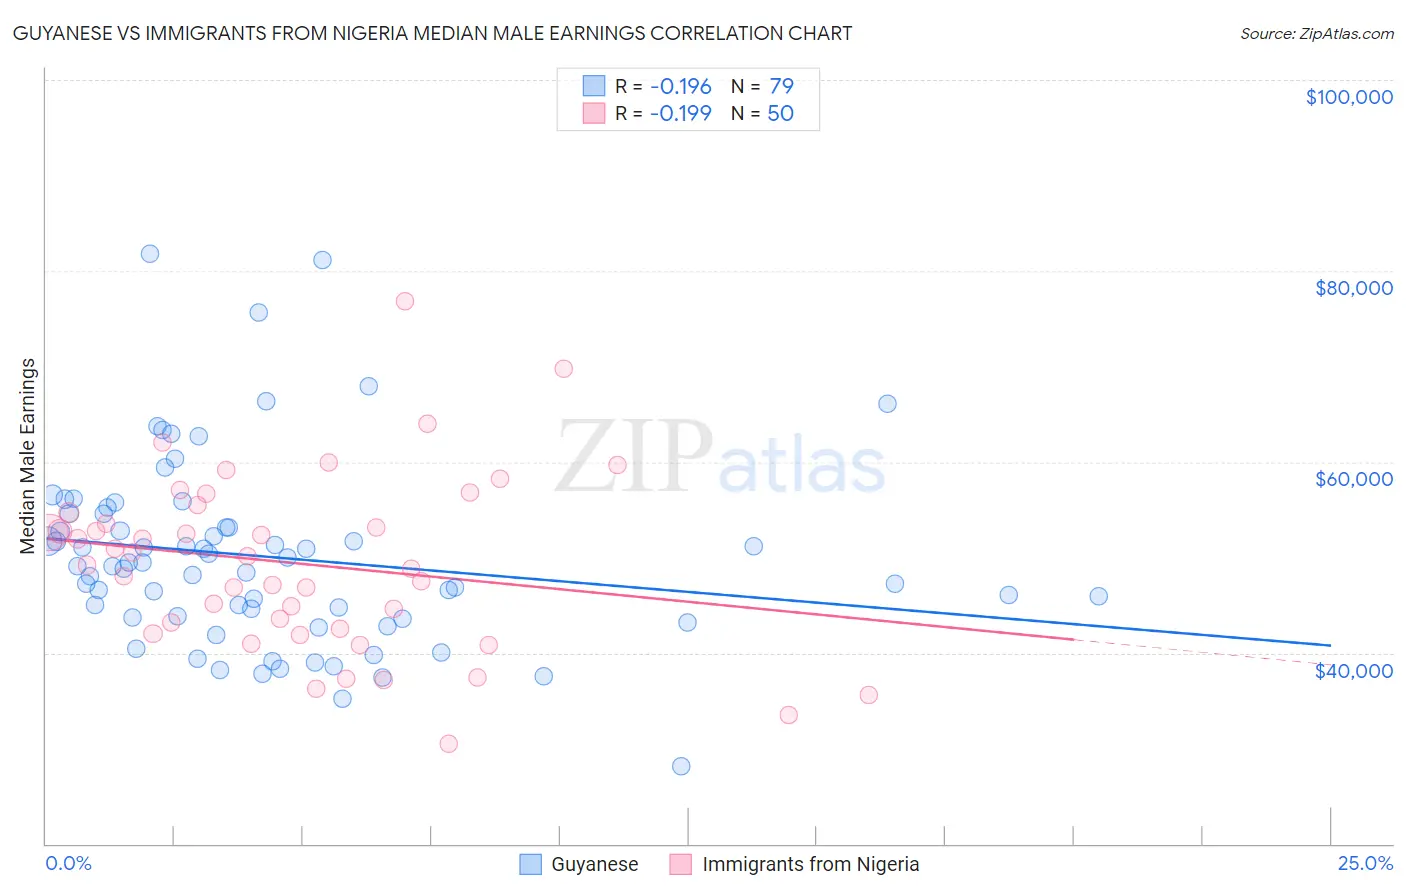
Guyanese vs Immigrants from Nigeria Median Male Earnings Correlation Chart
The statistical analysis conducted on geographies consisting of 176,926,771 people shows a poor negative correlation between the proportion of Guyanese and median male earnings in the United States with a correlation coefficient (R) of -0.196 and weighted average of $50,613. Similarly, the statistical analysis conducted on geographies consisting of 283,479,076 people shows a poor negative correlation between the proportion of Immigrants from Nigeria and median male earnings in the United States with a correlation coefficient (R) of -0.199 and weighted average of $51,310, a difference of 1.4%.
Median Male Earnings Correlation Summary
| Measurement | Guyanese | Immigrants from Nigeria |
| Minimum | $28,099 | $30,472 |
| Maximum | $81,815 | $76,820 |
| Range | $53,716 | $46,348 |
| Mean | $50,024 | $49,348 |
| Median | $49,104 | $49,638 |
| Interquartile 25% (IQ1) | $43,659 | $42,561 |
| Interquartile 75% (IQ3) | $54,533 | $54,633 |
| Interquartile Range (IQR) | $10,874 | $12,072 |
| Standard Deviation (Sample) | $9,787 | $9,267 |
| Standard Deviation (Population) | $9,725 | $9,173 |
Demographics Similar to Guyanese and Immigrants from Nigeria by Median Male Earnings
In terms of median male earnings, the demographic groups most similar to Guyanese are French American Indian ($50,611, a difference of 0.0%), Immigrants from St. Vincent and the Grenadines ($50,665, a difference of 0.10%), Houma ($50,547, a difference of 0.13%), West Indian ($50,682, a difference of 0.14%), and Hawaiian ($50,488, a difference of 0.25%). Similarly, the demographic groups most similar to Immigrants from Nigeria are Immigrants from Trinidad and Tobago ($51,376, a difference of 0.13%), Barbadian ($51,236, a difference of 0.14%), Samoan ($51,389, a difference of 0.16%), Sudanese ($51,216, a difference of 0.18%), and Trinidadian and Tobagonian ($51,446, a difference of 0.27%).
| Demographics | Rating | Rank | Median Male Earnings |
| Japanese | 4.9 /100 | #226 | Tragic $51,473 |
| Trinidadians and Tobagonians | 4.8 /100 | #227 | Tragic $51,446 |
| Samoans | 4.6 /100 | #228 | Tragic $51,389 |
| Immigrants | Trinidad and Tobago | 4.5 /100 | #229 | Tragic $51,376 |
| Immigrants | Nigeria | 4.2 /100 | #230 | Tragic $51,310 |
| Barbadians | 3.9 /100 | #231 | Tragic $51,236 |
| Sudanese | 3.9 /100 | #232 | Tragic $51,216 |
| Aleuts | 3.7 /100 | #233 | Tragic $51,168 |
| Cape Verdeans | 3.5 /100 | #234 | Tragic $51,103 |
| Immigrants | Western Africa | 3.0 /100 | #235 | Tragic $50,940 |
| Pennsylvania Germans | 2.8 /100 | #236 | Tragic $50,878 |
| Immigrants | Barbados | 2.6 /100 | #237 | Tragic $50,795 |
| Malaysians | 2.5 /100 | #238 | Tragic $50,772 |
| Americans | 2.5 /100 | #239 | Tragic $50,761 |
| West Indians | 2.3 /100 | #240 | Tragic $50,682 |
| Immigrants | St. Vincent and the Grenadines | 2.3 /100 | #241 | Tragic $50,665 |
| Guyanese | 2.2 /100 | #242 | Tragic $50,613 |
| French American Indians | 2.2 /100 | #243 | Tragic $50,611 |
| Houma | 2.0 /100 | #244 | Tragic $50,547 |
| Hawaiians | 1.9 /100 | #245 | Tragic $50,488 |
| Immigrants | Ecuador | 1.9 /100 | #246 | Tragic $50,474 |