Bangladeshi vs Cape Verdean Median Family Income
COMPARE
Bangladeshi
Cape Verdean
Median Family Income
Median Family Income Comparison
Bangladeshis
Cape Verdeans
$88,358
MEDIAN FAMILY INCOME
0.1/ 100
METRIC RATING
283rd/ 347
METRIC RANK
$91,848
MEDIAN FAMILY INCOME
0.4/ 100
METRIC RATING
259th/ 347
METRIC RANK
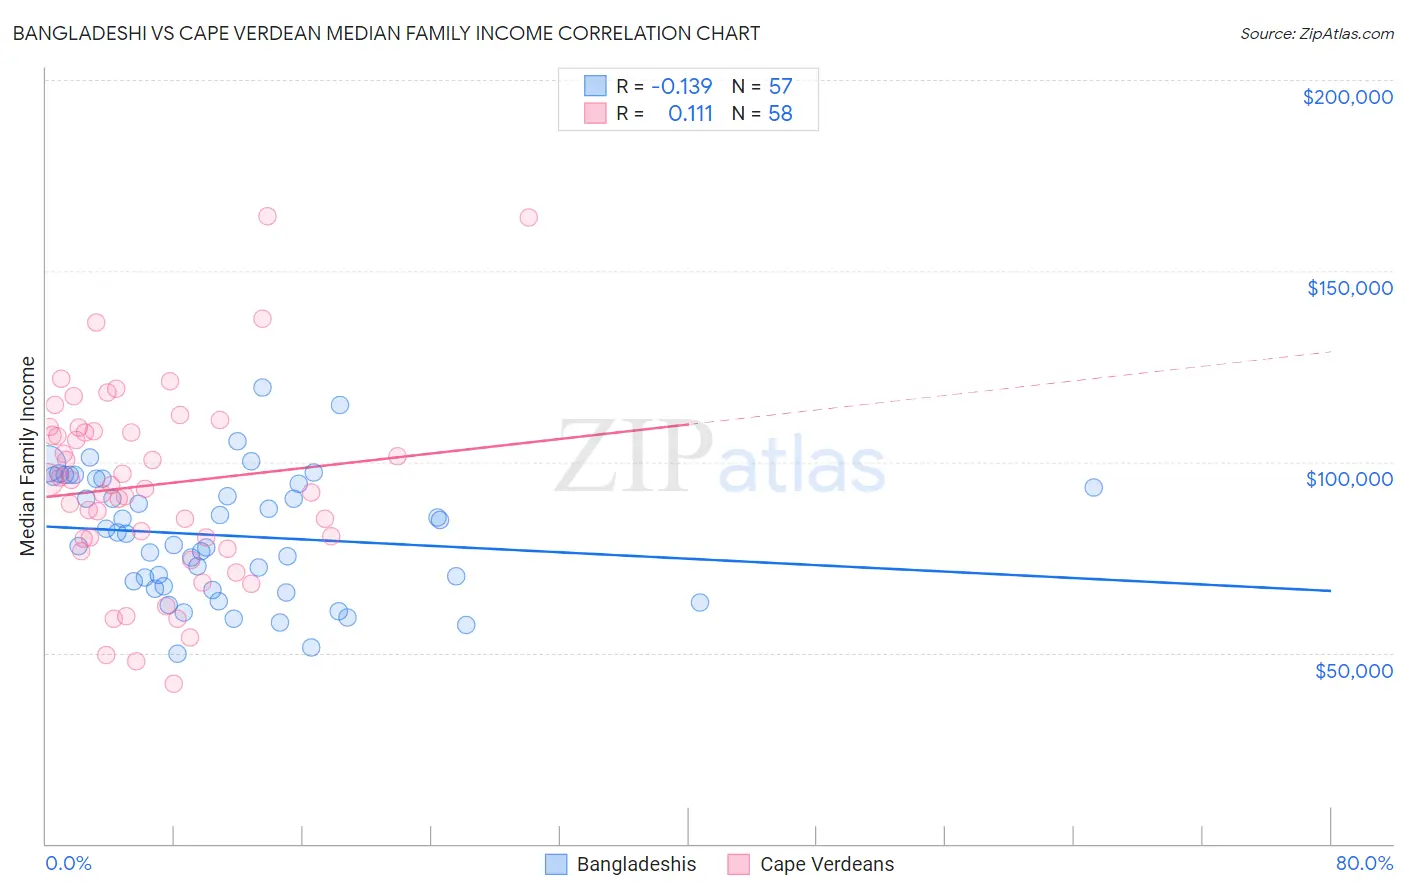
Bangladeshi vs Cape Verdean Median Family Income Correlation Chart
The statistical analysis conducted on geographies consisting of 141,321,089 people shows a poor negative correlation between the proportion of Bangladeshis and median family income in the United States with a correlation coefficient (R) of -0.139 and weighted average of $88,358. Similarly, the statistical analysis conducted on geographies consisting of 107,530,088 people shows a poor positive correlation between the proportion of Cape Verdeans and median family income in the United States with a correlation coefficient (R) of 0.111 and weighted average of $91,848, a difference of 4.0%.
Median Family Income Correlation Summary
| Measurement | Bangladeshi | Cape Verdean |
| Minimum | $49,670 | $41,875 |
| Maximum | $119,471 | $164,351 |
| Range | $69,801 | $122,476 |
| Mean | $80,654 | $93,845 |
| Median | $81,226 | $93,404 |
| Interquartile 25% (IQ1) | $67,095 | $79,783 |
| Interquartile 75% (IQ3) | $94,926 | $107,913 |
| Interquartile Range (IQR) | $27,831 | $28,129 |
| Standard Deviation (Sample) | $16,058 | $25,352 |
| Standard Deviation (Population) | $15,916 | $25,133 |
Similar Demographics by Median Family Income
Demographics Similar to Bangladeshis by Median Family Income
In terms of median family income, the demographic groups most similar to Bangladeshis are Indonesian ($88,301, a difference of 0.060%), Guatemalan ($88,295, a difference of 0.070%), Immigrants from Nicaragua ($88,267, a difference of 0.10%), Potawatomi ($88,265, a difference of 0.11%), and Cherokee ($88,209, a difference of 0.17%).
| Demographics | Rating | Rank | Median Family Income |
| Immigrants | Zaire | 0.1 /100 | #276 | Tragic $89,285 |
| Immigrants | Jamaica | 0.1 /100 | #277 | Tragic $89,268 |
| Immigrants | Grenada | 0.1 /100 | #278 | Tragic $89,249 |
| Immigrants | Belize | 0.1 /100 | #279 | Tragic $89,197 |
| British West Indians | 0.1 /100 | #280 | Tragic $88,987 |
| Blackfeet | 0.1 /100 | #281 | Tragic $88,717 |
| Comanche | 0.1 /100 | #282 | Tragic $88,556 |
| Bangladeshis | 0.1 /100 | #283 | Tragic $88,358 |
| Indonesians | 0.1 /100 | #284 | Tragic $88,301 |
| Guatemalans | 0.1 /100 | #285 | Tragic $88,295 |
| Immigrants | Nicaragua | 0.1 /100 | #286 | Tragic $88,267 |
| Potawatomi | 0.1 /100 | #287 | Tragic $88,265 |
| Cherokee | 0.1 /100 | #288 | Tragic $88,209 |
| Central American Indians | 0.1 /100 | #289 | Tragic $88,034 |
| Shoshone | 0.1 /100 | #290 | Tragic $87,872 |
Demographics Similar to Cape Verdeans by Median Family Income
In terms of median family income, the demographic groups most similar to Cape Verdeans are Osage ($91,926, a difference of 0.090%), Pennsylvania German ($91,763, a difference of 0.090%), Inupiat ($91,730, a difference of 0.13%), Liberian ($91,722, a difference of 0.14%), and American ($92,096, a difference of 0.27%).
| Demographics | Rating | Rank | Median Family Income |
| Immigrants | El Salvador | 0.6 /100 | #252 | Tragic $92,545 |
| Immigrants | Guyana | 0.6 /100 | #253 | Tragic $92,513 |
| Immigrants | Barbados | 0.5 /100 | #254 | Tragic $92,419 |
| Immigrants | Laos | 0.5 /100 | #255 | Tragic $92,239 |
| Nicaraguans | 0.5 /100 | #256 | Tragic $92,231 |
| Americans | 0.4 /100 | #257 | Tragic $92,096 |
| Osage | 0.4 /100 | #258 | Tragic $91,926 |
| Cape Verdeans | 0.4 /100 | #259 | Tragic $91,848 |
| Pennsylvania Germans | 0.4 /100 | #260 | Tragic $91,763 |
| Inupiat | 0.4 /100 | #261 | Tragic $91,730 |
| Liberians | 0.4 /100 | #262 | Tragic $91,722 |
| Immigrants | West Indies | 0.3 /100 | #263 | Tragic $91,588 |
| Senegalese | 0.3 /100 | #264 | Tragic $91,475 |
| Hmong | 0.3 /100 | #265 | Tragic $91,296 |
| Central Americans | 0.3 /100 | #266 | Tragic $91,087 |