Laotian vs Korean Householder Income Ages 45 - 64 years
COMPARE
Laotian
Korean
Householder Income Ages 45 - 64 years
Householder Income Ages 45 - 64 years Comparison
Laotians
Koreans
$111,051
HOUSEHOLDER INCOME AGES 45 - 64 YEARS
99.5/ 100
METRIC RATING
67th/ 347
METRIC RANK
$110,334
HOUSEHOLDER INCOME AGES 45 - 64 YEARS
99.3/ 100
METRIC RATING
70th/ 347
METRIC RANK
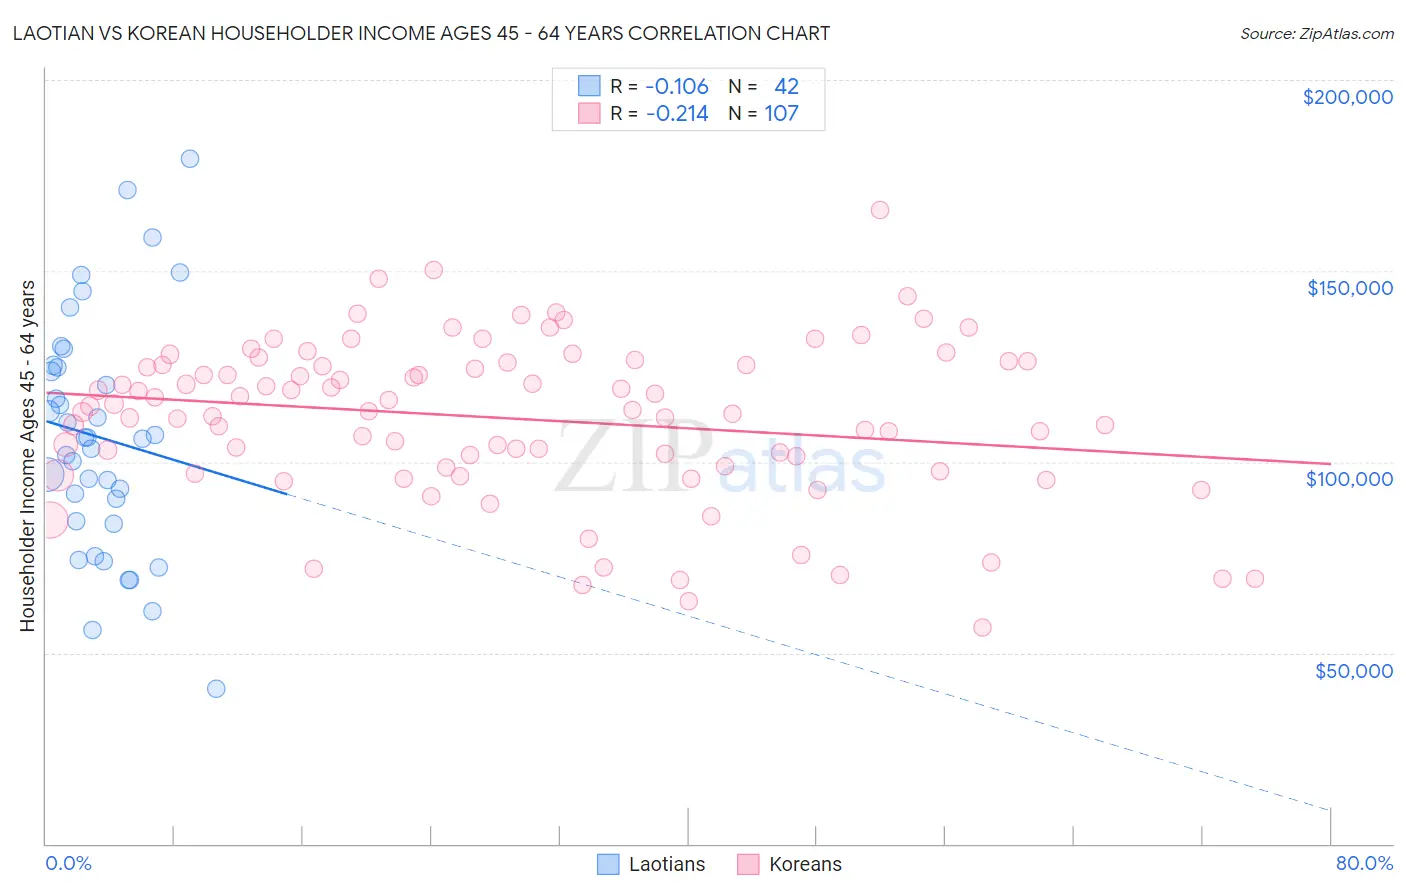
Laotian vs Korean Householder Income Ages 45 - 64 years Correlation Chart
The statistical analysis conducted on geographies consisting of 224,613,434 people shows a poor negative correlation between the proportion of Laotians and household income with householder between the ages 45 and 64 in the United States with a correlation coefficient (R) of -0.106 and weighted average of $111,051. Similarly, the statistical analysis conducted on geographies consisting of 509,189,713 people shows a weak negative correlation between the proportion of Koreans and household income with householder between the ages 45 and 64 in the United States with a correlation coefficient (R) of -0.214 and weighted average of $110,334, a difference of 0.65%.
Householder Income Ages 45 - 64 years Correlation Summary
| Measurement | Laotian | Korean |
| Minimum | $40,547 | $56,563 |
| Maximum | $179,286 | $166,010 |
| Range | $138,739 | $109,447 |
| Mean | $106,378 | $111,314 |
| Median | $106,231 | $113,513 |
| Interquartile 25% (IQ1) | $84,487 | $98,457 |
| Interquartile 75% (IQ3) | $124,834 | $126,141 |
| Interquartile Range (IQR) | $40,347 | $27,684 |
| Standard Deviation (Sample) | $30,879 | $20,923 |
| Standard Deviation (Population) | $30,509 | $20,825 |
Demographics Similar to Laotians and Koreans by Householder Income Ages 45 - 64 years
In terms of householder income ages 45 - 64 years, the demographic groups most similar to Laotians are New Zealander ($111,286, a difference of 0.21%), Immigrants from Belarus ($111,430, a difference of 0.34%), Immigrants from Latvia ($111,454, a difference of 0.36%), Immigrants from Romania ($110,633, a difference of 0.38%), and Mongolian ($111,602, a difference of 0.50%). Similarly, the demographic groups most similar to Koreans are Immigrants from Italy ($110,434, a difference of 0.090%), Italian ($110,224, a difference of 0.10%), Assyrian/Chaldean/Syriac ($110,201, a difference of 0.12%), Argentinean ($110,103, a difference of 0.21%), and Immigrants from Romania ($110,633, a difference of 0.27%).
| Demographics | Rating | Rank | Householder Income Ages 45 - 64 years |
| Soviet Union | 99.7 /100 | #58 | Exceptional $112,008 |
| Immigrants | Europe | 99.7 /100 | #59 | Exceptional $111,984 |
| Immigrants | Netherlands | 99.7 /100 | #60 | Exceptional $111,982 |
| Immigrants | Czechoslovakia | 99.7 /100 | #61 | Exceptional $111,914 |
| Immigrants | Norway | 99.7 /100 | #62 | Exceptional $111,669 |
| Mongolians | 99.6 /100 | #63 | Exceptional $111,602 |
| Immigrants | Latvia | 99.6 /100 | #64 | Exceptional $111,454 |
| Immigrants | Belarus | 99.6 /100 | #65 | Exceptional $111,430 |
| New Zealanders | 99.6 /100 | #66 | Exceptional $111,286 |
| Laotians | 99.5 /100 | #67 | Exceptional $111,051 |
| Immigrants | Romania | 99.4 /100 | #68 | Exceptional $110,633 |
| Immigrants | Italy | 99.4 /100 | #69 | Exceptional $110,434 |
| Koreans | 99.3 /100 | #70 | Exceptional $110,334 |
| Italians | 99.3 /100 | #71 | Exceptional $110,224 |
| Assyrians/Chaldeans/Syriacs | 99.3 /100 | #72 | Exceptional $110,201 |
| Argentineans | 99.3 /100 | #73 | Exceptional $110,103 |
| Immigrants | Egypt | 99.2 /100 | #74 | Exceptional $109,941 |
| South Africans | 99.1 /100 | #75 | Exceptional $109,719 |
| Paraguayans | 99.0 /100 | #76 | Exceptional $109,447 |
| Immigrants | England | 99.0 /100 | #77 | Exceptional $109,446 |
| Immigrants | Canada | 99.0 /100 | #78 | Exceptional $109,402 |