Austrian vs Immigrants from Southern Europe Householder Income Ages 45 - 64 years
COMPARE
Austrian
Immigrants from Southern Europe
Householder Income Ages 45 - 64 years
Householder Income Ages 45 - 64 years Comparison
Austrians
Immigrants from Southern Europe
$108,692
HOUSEHOLDER INCOME AGES 45 - 64 YEARS
98.5/ 100
METRIC RATING
86th/ 347
METRIC RANK
$107,775
HOUSEHOLDER INCOME AGES 45 - 64 YEARS
97.7/ 100
METRIC RATING
98th/ 347
METRIC RANK
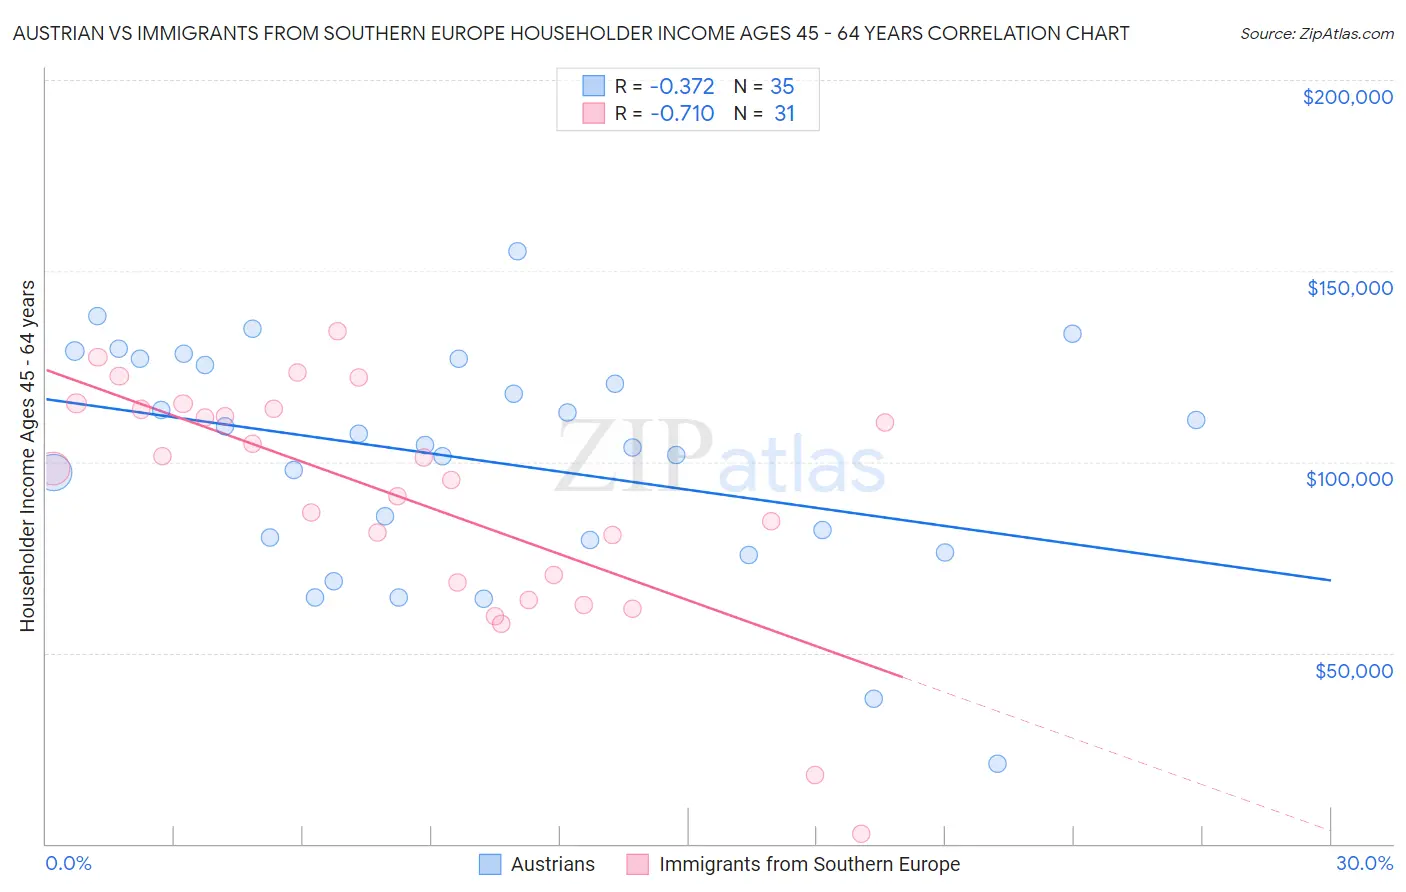
Austrian vs Immigrants from Southern Europe Householder Income Ages 45 - 64 years Correlation Chart
The statistical analysis conducted on geographies consisting of 451,173,379 people shows a mild negative correlation between the proportion of Austrians and household income with householder between the ages 45 and 64 in the United States with a correlation coefficient (R) of -0.372 and weighted average of $108,692. Similarly, the statistical analysis conducted on geographies consisting of 402,204,768 people shows a strong negative correlation between the proportion of Immigrants from Southern Europe and household income with householder between the ages 45 and 64 in the United States with a correlation coefficient (R) of -0.710 and weighted average of $107,775, a difference of 0.85%.
Householder Income Ages 45 - 64 years Correlation Summary
| Measurement | Austrian | Immigrants from Southern Europe |
| Minimum | $20,833 | $2,499 |
| Maximum | $155,000 | $134,237 |
| Range | $134,167 | $131,738 |
| Mean | $100,755 | $90,713 |
| Median | $104,463 | $98,268 |
| Interquartile 25% (IQ1) | $79,395 | $68,345 |
| Interquartile 75% (IQ3) | $126,954 | $113,880 |
| Interquartile Range (IQR) | $47,559 | $45,535 |
| Standard Deviation (Sample) | $29,820 | $31,080 |
| Standard Deviation (Population) | $29,391 | $30,575 |
Demographics Similar to Austrians and Immigrants from Southern Europe by Householder Income Ages 45 - 64 years
In terms of householder income ages 45 - 64 years, the demographic groups most similar to Austrians are Tongan ($108,643, a difference of 0.040%), Romanian ($108,609, a difference of 0.080%), Immigrants from Afghanistan ($108,785, a difference of 0.090%), Immigrants from Western Europe ($108,824, a difference of 0.12%), and Ukrainian ($108,475, a difference of 0.20%). Similarly, the demographic groups most similar to Immigrants from Southern Europe are Palestinian ($107,721, a difference of 0.050%), Northern European ($107,870, a difference of 0.090%), Immigrants from Serbia ($107,569, a difference of 0.19%), Immigrants from Kazakhstan ($107,378, a difference of 0.37%), and Immigrants from Moldova ($107,357, a difference of 0.39%).
| Demographics | Rating | Rank | Householder Income Ages 45 - 64 years |
| Immigrants | North America | 98.8 /100 | #82 | Exceptional $109,198 |
| Immigrants | Spain | 98.8 /100 | #83 | Exceptional $109,051 |
| Immigrants | Western Europe | 98.6 /100 | #84 | Exceptional $108,824 |
| Immigrants | Afghanistan | 98.6 /100 | #85 | Exceptional $108,785 |
| Austrians | 98.5 /100 | #86 | Exceptional $108,692 |
| Tongans | 98.5 /100 | #87 | Exceptional $108,643 |
| Romanians | 98.5 /100 | #88 | Exceptional $108,609 |
| Ukrainians | 98.3 /100 | #89 | Exceptional $108,475 |
| Immigrants | Philippines | 98.3 /100 | #90 | Exceptional $108,471 |
| Immigrants | Lebanon | 98.3 /100 | #91 | Exceptional $108,471 |
| Croatians | 98.3 /100 | #92 | Exceptional $108,383 |
| Immigrants | Croatia | 98.2 /100 | #93 | Exceptional $108,304 |
| Sri Lankans | 98.2 /100 | #94 | Exceptional $108,270 |
| Immigrants | Hungary | 98.2 /100 | #95 | Exceptional $108,267 |
| Immigrants | Argentina | 98.2 /100 | #96 | Exceptional $108,264 |
| Northern Europeans | 97.8 /100 | #97 | Exceptional $107,870 |
| Immigrants | Southern Europe | 97.7 /100 | #98 | Exceptional $107,775 |
| Palestinians | 97.6 /100 | #99 | Exceptional $107,721 |
| Immigrants | Serbia | 97.4 /100 | #100 | Exceptional $107,569 |
| Immigrants | Kazakhstan | 97.2 /100 | #101 | Exceptional $107,378 |
| Immigrants | Moldova | 97.1 /100 | #102 | Exceptional $107,357 |