Paraguayan vs Immigrants from Hong Kong Householder Income Over 65 years
COMPARE
Paraguayan
Immigrants from Hong Kong
Householder Income Over 65 years
Householder Income Over 65 years Comparison
Paraguayans
Immigrants from Hong Kong
$64,443
HOUSEHOLDER INCOME OVER 65 YEARS
97.4/ 100
METRIC RATING
89th/ 347
METRIC RANK
$71,567
HOUSEHOLDER INCOME OVER 65 YEARS
100.0/ 100
METRIC RATING
13th/ 347
METRIC RANK
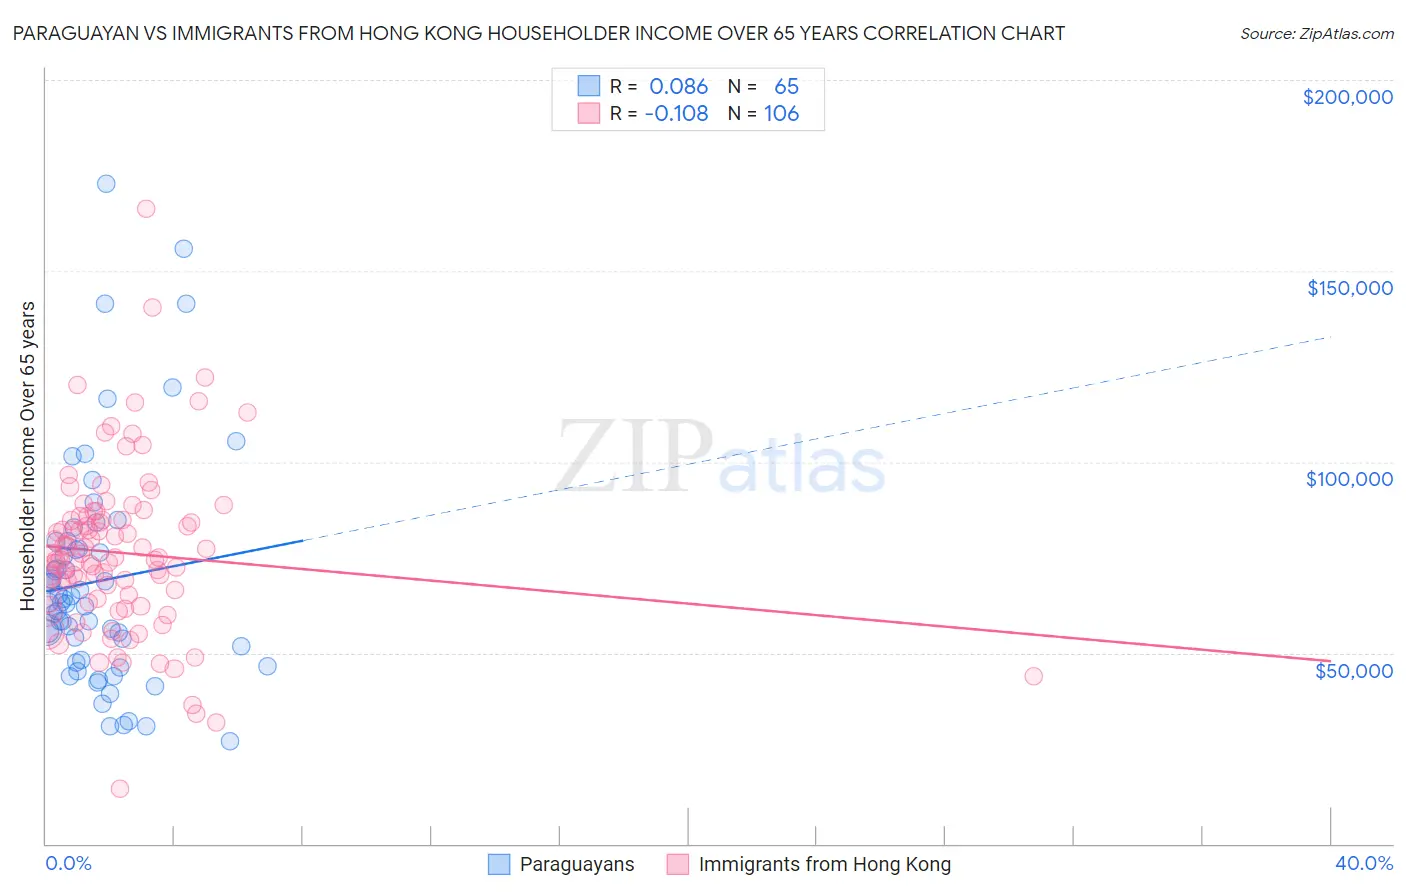
Paraguayan vs Immigrants from Hong Kong Householder Income Over 65 years Correlation Chart
The statistical analysis conducted on geographies consisting of 95,003,306 people shows a slight positive correlation between the proportion of Paraguayans and household income with householder over the age of 65 in the United States with a correlation coefficient (R) of 0.086 and weighted average of $64,443. Similarly, the statistical analysis conducted on geographies consisting of 253,485,183 people shows a poor negative correlation between the proportion of Immigrants from Hong Kong and household income with householder over the age of 65 in the United States with a correlation coefficient (R) of -0.108 and weighted average of $71,567, a difference of 11.1%.
Householder Income Over 65 years Correlation Summary
| Measurement | Paraguayan | Immigrants from Hong Kong |
| Minimum | $26,765 | $14,323 |
| Maximum | $172,969 | $166,250 |
| Range | $146,204 | $151,927 |
| Mean | $68,770 | $76,158 |
| Median | $63,287 | $74,716 |
| Interquartile 25% (IQ1) | $47,789 | $63,807 |
| Interquartile 75% (IQ3) | $78,220 | $84,771 |
| Interquartile Range (IQR) | $30,430 | $20,964 |
| Standard Deviation (Sample) | $29,858 | $21,933 |
| Standard Deviation (Population) | $29,627 | $21,829 |
Similar Demographics by Householder Income Over 65 years
Demographics Similar to Paraguayans by Householder Income Over 65 years
In terms of householder income over 65 years, the demographic groups most similar to Paraguayans are Immigrants from Kuwait ($64,433, a difference of 0.020%), Immigrants from Romania ($64,462, a difference of 0.030%), Austrian ($64,470, a difference of 0.040%), Immigrants from Oceania ($64,416, a difference of 0.040%), and Immigrants from Bulgaria ($64,379, a difference of 0.10%).
| Demographics | Rating | Rank | Householder Income Over 65 years |
| Immigrants | Fiji | 98.2 /100 | #82 | Exceptional $64,795 |
| Northern Europeans | 97.9 /100 | #83 | Exceptional $64,658 |
| Immigrants | Greece | 97.9 /100 | #84 | Exceptional $64,636 |
| Immigrants | Lebanon | 97.6 /100 | #85 | Exceptional $64,521 |
| Immigrants | Russia | 97.6 /100 | #86 | Exceptional $64,512 |
| Austrians | 97.5 /100 | #87 | Exceptional $64,470 |
| Immigrants | Romania | 97.5 /100 | #88 | Exceptional $64,462 |
| Paraguayans | 97.4 /100 | #89 | Exceptional $64,443 |
| Immigrants | Kuwait | 97.4 /100 | #90 | Exceptional $64,433 |
| Immigrants | Oceania | 97.4 /100 | #91 | Exceptional $64,416 |
| Immigrants | Bulgaria | 97.3 /100 | #92 | Exceptional $64,379 |
| Jordanians | 97.1 /100 | #93 | Exceptional $64,313 |
| Immigrants | Egypt | 97.0 /100 | #94 | Exceptional $64,299 |
| Immigrants | Latvia | 97.0 /100 | #95 | Exceptional $64,298 |
| Immigrants | Hungary | 97.0 /100 | #96 | Exceptional $64,277 |
Demographics Similar to Immigrants from Hong Kong by Householder Income Over 65 years
In terms of householder income over 65 years, the demographic groups most similar to Immigrants from Hong Kong are Cypriot ($71,714, a difference of 0.20%), Burmese ($71,139, a difference of 0.60%), Thai ($72,099, a difference of 0.74%), Native Hawaiian ($71,021, a difference of 0.77%), and Bhutanese ($72,288, a difference of 1.0%).
| Demographics | Rating | Rank | Householder Income Over 65 years |
| Bolivians | 100.0 /100 | #6 | Exceptional $74,245 |
| Immigrants | Bolivia | 100.0 /100 | #7 | Exceptional $73,434 |
| Immigrants | Singapore | 100.0 /100 | #8 | Exceptional $72,963 |
| Immigrants | India | 100.0 /100 | #9 | Exceptional $72,804 |
| Bhutanese | 100.0 /100 | #10 | Exceptional $72,288 |
| Thais | 100.0 /100 | #11 | Exceptional $72,099 |
| Cypriots | 100.0 /100 | #12 | Exceptional $71,714 |
| Immigrants | Hong Kong | 100.0 /100 | #13 | Exceptional $71,567 |
| Burmese | 100.0 /100 | #14 | Exceptional $71,139 |
| Native Hawaiians | 100.0 /100 | #15 | Exceptional $71,021 |
| Okinawans | 100.0 /100 | #16 | Exceptional $70,846 |
| Immigrants | Korea | 100.0 /100 | #17 | Exceptional $70,696 |
| Eastern Europeans | 100.0 /100 | #18 | Exceptional $70,470 |
| Indians (Asian) | 100.0 /100 | #19 | Exceptional $70,238 |
| Immigrants | South Central Asia | 100.0 /100 | #20 | Exceptional $70,103 |