Arab vs Immigrants from Egypt Median Family Income
COMPARE
Arab
Immigrants from Egypt
Median Family Income
Median Family Income Comparison
Arabs
Immigrants from Egypt
$106,952
MEDIAN FAMILY INCOME
89.9/ 100
METRIC RATING
129th/ 347
METRIC RANK
$111,689
MEDIAN FAMILY INCOME
99.0/ 100
METRIC RATING
83rd/ 347
METRIC RANK
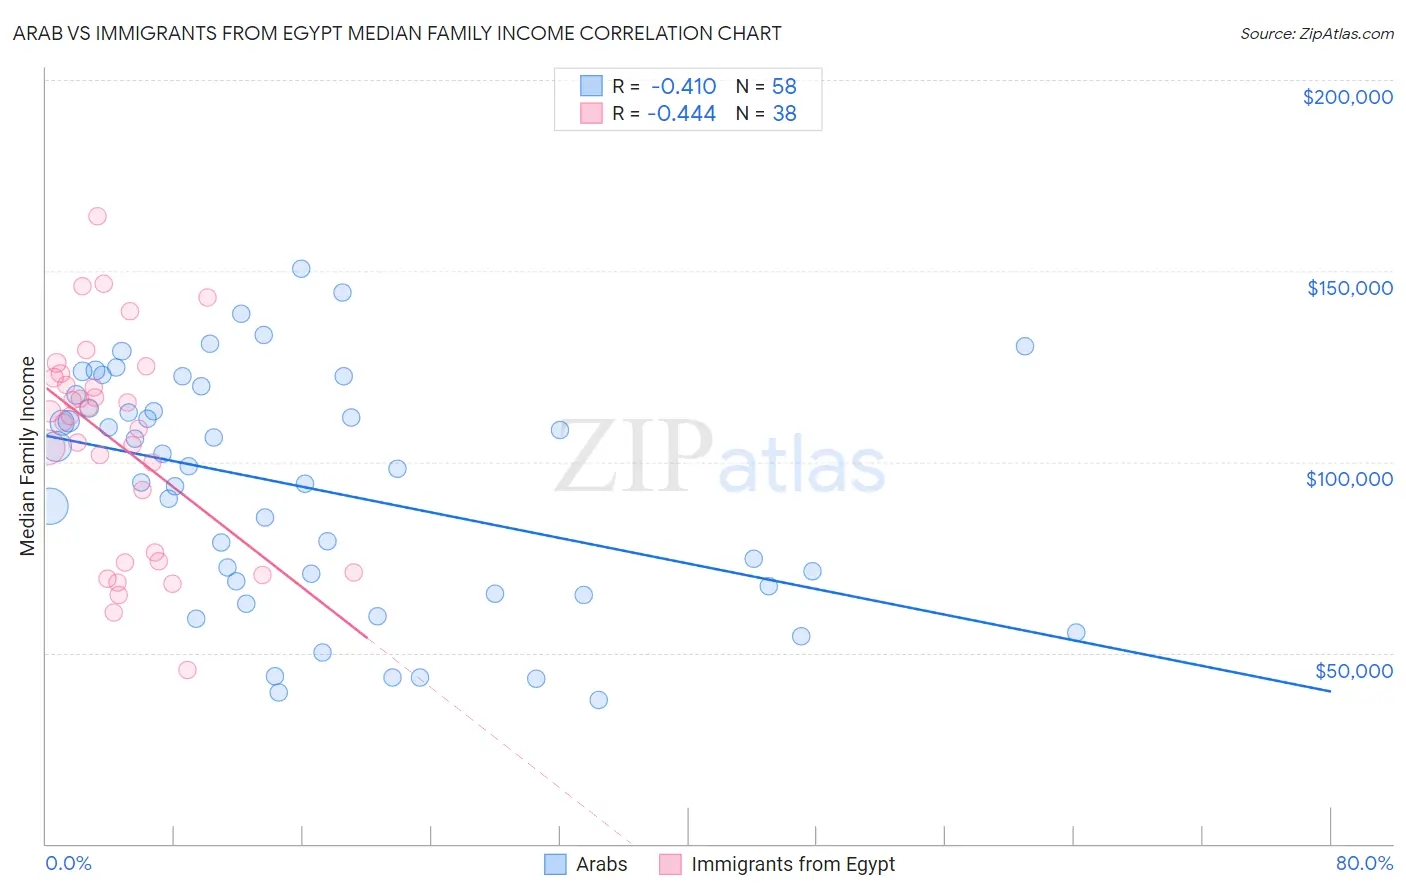
Arab vs Immigrants from Egypt Median Family Income Correlation Chart
The statistical analysis conducted on geographies consisting of 486,153,527 people shows a moderate negative correlation between the proportion of Arabs and median family income in the United States with a correlation coefficient (R) of -0.410 and weighted average of $106,952. Similarly, the statistical analysis conducted on geographies consisting of 245,384,191 people shows a moderate negative correlation between the proportion of Immigrants from Egypt and median family income in the United States with a correlation coefficient (R) of -0.444 and weighted average of $111,689, a difference of 4.4%.
Median Family Income Correlation Summary
| Measurement | Arab | Immigrants from Egypt |
| Minimum | $37,540 | $45,581 |
| Maximum | $150,441 | $164,298 |
| Range | $112,901 | $118,717 |
| Mean | $93,185 | $104,674 |
| Median | $98,519 | $111,132 |
| Interquartile 25% (IQ1) | $67,570 | $74,063 |
| Interquartile 75% (IQ3) | $117,614 | $122,004 |
| Interquartile Range (IQR) | $50,044 | $47,941 |
| Standard Deviation (Sample) | $30,451 | $28,077 |
| Standard Deviation (Population) | $30,188 | $27,705 |
Similar Demographics by Median Family Income
Demographics Similar to Arabs by Median Family Income
In terms of median family income, the demographic groups most similar to Arabs are Brazilian ($106,942, a difference of 0.010%), Immigrants from Ethiopia ($106,969, a difference of 0.020%), Lebanese ($107,086, a difference of 0.12%), Serbian ($107,157, a difference of 0.19%), and Taiwanese ($107,295, a difference of 0.32%).
| Demographics | Rating | Rank | Median Family Income |
| Immigrants | Jordan | 92.9 /100 | #122 | Exceptional $107,715 |
| Carpatho Rusyns | 92.2 /100 | #123 | Exceptional $107,502 |
| Pakistanis | 91.7 /100 | #124 | Exceptional $107,390 |
| Taiwanese | 91.4 /100 | #125 | Exceptional $107,295 |
| Serbians | 90.8 /100 | #126 | Exceptional $107,157 |
| Lebanese | 90.5 /100 | #127 | Exceptional $107,086 |
| Immigrants | Ethiopia | 90.0 /100 | #128 | Excellent $106,969 |
| Arabs | 89.9 /100 | #129 | Excellent $106,952 |
| Brazilians | 89.8 /100 | #130 | Excellent $106,942 |
| Canadians | 88.1 /100 | #131 | Excellent $106,597 |
| Immigrants | Fiji | 87.8 /100 | #132 | Excellent $106,544 |
| Ugandans | 87.8 /100 | #133 | Excellent $106,541 |
| Immigrants | Oceania | 87.3 /100 | #134 | Excellent $106,453 |
| Portuguese | 86.3 /100 | #135 | Excellent $106,286 |
| Immigrants | South Eastern Asia | 86.1 /100 | #136 | Excellent $106,252 |
Demographics Similar to Immigrants from Egypt by Median Family Income
In terms of median family income, the demographic groups most similar to Immigrants from Egypt are Immigrants from Hungary ($111,378, a difference of 0.28%), Croatian ($111,370, a difference of 0.29%), Ukrainian ($111,368, a difference of 0.29%), Immigrants from England ($112,038, a difference of 0.31%), and Austrian ($111,306, a difference of 0.34%).
| Demographics | Rating | Rank | Median Family Income |
| Argentineans | 99.4 /100 | #76 | Exceptional $112,665 |
| Immigrants | Eastern Europe | 99.4 /100 | #77 | Exceptional $112,527 |
| Immigrants | Canada | 99.3 /100 | #78 | Exceptional $112,374 |
| Italians | 99.3 /100 | #79 | Exceptional $112,372 |
| Immigrants | Croatia | 99.3 /100 | #80 | Exceptional $112,323 |
| Immigrants | North America | 99.2 /100 | #81 | Exceptional $112,151 |
| Immigrants | England | 99.2 /100 | #82 | Exceptional $112,038 |
| Immigrants | Egypt | 99.0 /100 | #83 | Exceptional $111,689 |
| Immigrants | Hungary | 98.8 /100 | #84 | Exceptional $111,378 |
| Croatians | 98.8 /100 | #85 | Exceptional $111,370 |
| Ukrainians | 98.8 /100 | #86 | Exceptional $111,368 |
| Austrians | 98.8 /100 | #87 | Exceptional $111,306 |
| Romanians | 98.8 /100 | #88 | Exceptional $111,243 |
| Immigrants | Argentina | 98.5 /100 | #89 | Exceptional $110,873 |
| Northern Europeans | 98.3 /100 | #90 | Exceptional $110,635 |