American vs Immigrants from Hungary Householder Income Under 25 years
COMPARE
American
Immigrants from Hungary
Householder Income Under 25 years
Householder Income Under 25 years Comparison
Americans
Immigrants from Hungary
$48,860
HOUSEHOLDER INCOME UNDER 25 YEARS
0.0/ 100
METRIC RATING
290th/ 347
METRIC RANK
$52,798
HOUSEHOLDER INCOME UNDER 25 YEARS
81.6/ 100
METRIC RATING
146th/ 347
METRIC RANK
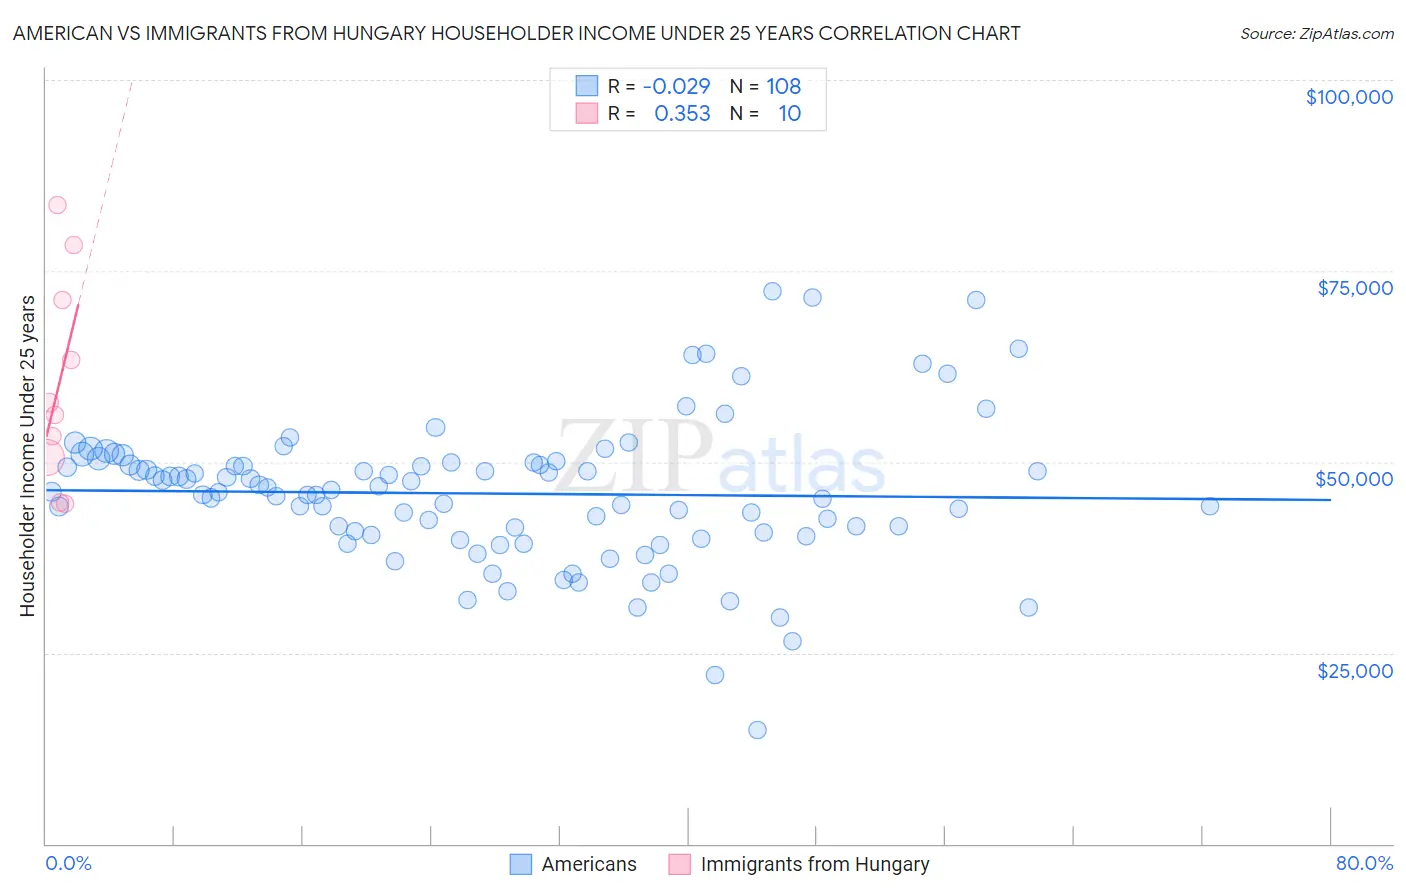
American vs Immigrants from Hungary Householder Income Under 25 years Correlation Chart
The statistical analysis conducted on geographies consisting of 442,353,871 people shows no correlation between the proportion of Americans and household income with householder under the age of 25 in the United States with a correlation coefficient (R) of -0.029 and weighted average of $48,860. Similarly, the statistical analysis conducted on geographies consisting of 172,348,525 people shows a mild positive correlation between the proportion of Immigrants from Hungary and household income with householder under the age of 25 in the United States with a correlation coefficient (R) of 0.353 and weighted average of $52,798, a difference of 8.1%.
Householder Income Under 25 years Correlation Summary
| Measurement | American | Immigrants from Hungary |
| Minimum | $14,959 | $44,480 |
| Maximum | $72,300 | $83,563 |
| Range | $57,341 | $39,083 |
| Mean | $45,842 | $60,366 |
| Median | $46,208 | $56,972 |
| Interquartile 25% (IQ1) | $40,591 | $50,615 |
| Interquartile 75% (IQ3) | $49,749 | $71,208 |
| Interquartile Range (IQR) | $9,157 | $20,593 |
| Standard Deviation (Sample) | $9,439 | $13,557 |
| Standard Deviation (Population) | $9,395 | $12,862 |
Similar Demographics by Householder Income Under 25 years
Demographics Similar to Americans by Householder Income Under 25 years
In terms of householder income under 25 years, the demographic groups most similar to Americans are Honduran ($48,885, a difference of 0.050%), Liberian ($48,917, a difference of 0.12%), Senegalese ($48,953, a difference of 0.19%), Immigrants from Burma/Myanmar ($48,749, a difference of 0.23%), and French American Indian ($48,977, a difference of 0.24%).
| Demographics | Rating | Rank | Householder Income Under 25 years |
| Immigrants | Nigeria | 0.1 /100 | #283 | Tragic $49,174 |
| Carpatho Rusyns | 0.1 /100 | #284 | Tragic $49,113 |
| Scotch-Irish | 0.0 /100 | #285 | Tragic $49,039 |
| French American Indians | 0.0 /100 | #286 | Tragic $48,977 |
| Senegalese | 0.0 /100 | #287 | Tragic $48,953 |
| Liberians | 0.0 /100 | #288 | Tragic $48,917 |
| Hondurans | 0.0 /100 | #289 | Tragic $48,885 |
| Americans | 0.0 /100 | #290 | Tragic $48,860 |
| Immigrants | Burma/Myanmar | 0.0 /100 | #291 | Tragic $48,749 |
| Shoshone | 0.0 /100 | #292 | Tragic $48,720 |
| Sub-Saharan Africans | 0.0 /100 | #293 | Tragic $48,691 |
| Somalis | 0.0 /100 | #294 | Tragic $48,657 |
| Central American Indians | 0.0 /100 | #295 | Tragic $48,643 |
| Blackfeet | 0.0 /100 | #296 | Tragic $48,603 |
| Cree | 0.0 /100 | #297 | Tragic $48,514 |
Demographics Similar to Immigrants from Hungary by Householder Income Under 25 years
In terms of householder income under 25 years, the demographic groups most similar to Immigrants from Hungary are Latvian ($52,783, a difference of 0.030%), French Canadian ($52,672, a difference of 0.24%), Scandinavian ($52,654, a difference of 0.27%), Immigrants from Costa Rica ($52,643, a difference of 0.29%), and Immigrants from Western Europe ($52,957, a difference of 0.30%).
| Demographics | Rating | Rank | Householder Income Under 25 years |
| Costa Ricans | 90.4 /100 | #139 | Exceptional $53,106 |
| Hawaiians | 89.8 /100 | #140 | Excellent $53,078 |
| Danes | 88.9 /100 | #141 | Excellent $53,041 |
| Immigrants | Armenia | 87.5 /100 | #142 | Excellent $52,986 |
| Swedes | 87.5 /100 | #143 | Excellent $52,986 |
| South American Indians | 87.3 /100 | #144 | Excellent $52,979 |
| Immigrants | Western Europe | 86.7 /100 | #145 | Excellent $52,957 |
| Immigrants | Hungary | 81.6 /100 | #146 | Excellent $52,798 |
| Latvians | 81.0 /100 | #147 | Excellent $52,783 |
| French Canadians | 76.5 /100 | #148 | Good $52,672 |
| Scandinavians | 75.7 /100 | #149 | Good $52,654 |
| Immigrants | Costa Rica | 75.2 /100 | #150 | Good $52,643 |
| Immigrants | Scotland | 75.0 /100 | #151 | Good $52,638 |
| Trinidadians and Tobagonians | 74.6 /100 | #152 | Good $52,631 |
| Central Americans | 74.4 /100 | #153 | Good $52,626 |