Norwegian vs Northern European Householder Income Ages 45 - 64 years
COMPARE
Norwegian
Northern European
Householder Income Ages 45 - 64 years
Householder Income Ages 45 - 64 years Comparison
Norwegians
Northern Europeans
$103,682
HOUSEHOLDER INCOME AGES 45 - 64 YEARS
84.3/ 100
METRIC RATING
140th/ 347
METRIC RANK
$107,870
HOUSEHOLDER INCOME AGES 45 - 64 YEARS
97.8/ 100
METRIC RATING
97th/ 347
METRIC RANK
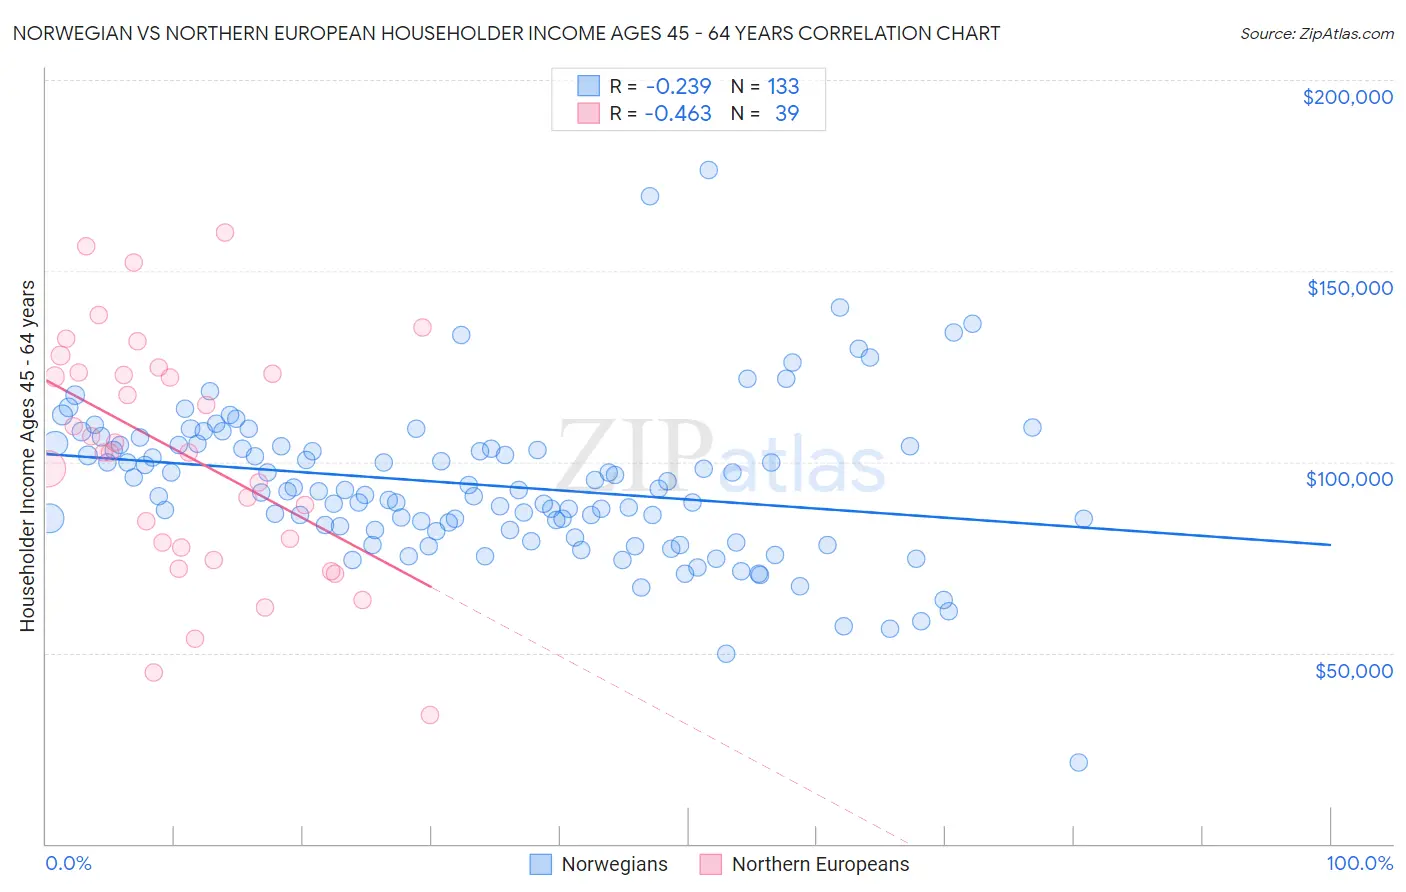
Norwegian vs Northern European Householder Income Ages 45 - 64 years Correlation Chart
The statistical analysis conducted on geographies consisting of 530,964,543 people shows a weak negative correlation between the proportion of Norwegians and household income with householder between the ages 45 and 64 in the United States with a correlation coefficient (R) of -0.239 and weighted average of $103,682. Similarly, the statistical analysis conducted on geographies consisting of 405,435,990 people shows a moderate negative correlation between the proportion of Northern Europeans and household income with householder between the ages 45 and 64 in the United States with a correlation coefficient (R) of -0.463 and weighted average of $107,870, a difference of 4.0%.
Householder Income Ages 45 - 64 years Correlation Summary
| Measurement | Norwegian | Northern European |
| Minimum | $21,250 | $33,594 |
| Maximum | $176,301 | $160,179 |
| Range | $155,051 | $126,585 |
| Mean | $93,934 | $101,869 |
| Median | $92,185 | $102,539 |
| Interquartile 25% (IQ1) | $82,157 | $77,586 |
| Interquartile 75% (IQ3) | $104,273 | $123,289 |
| Interquartile Range (IQR) | $22,116 | $45,703 |
| Standard Deviation (Sample) | $20,569 | $30,827 |
| Standard Deviation (Population) | $20,492 | $30,430 |
Similar Demographics by Householder Income Ages 45 - 64 years
Demographics Similar to Norwegians by Householder Income Ages 45 - 64 years
In terms of householder income ages 45 - 64 years, the demographic groups most similar to Norwegians are Immigrants from Oceania ($103,705, a difference of 0.020%), Ethiopian ($103,736, a difference of 0.050%), Immigrants from Uganda ($103,584, a difference of 0.090%), Luxembourger ($103,536, a difference of 0.14%), and Serbian ($103,522, a difference of 0.15%).
| Demographics | Rating | Rank | Householder Income Ages 45 - 64 years |
| Arabs | 89.3 /100 | #133 | Excellent $104,566 |
| Canadians | 89.3 /100 | #134 | Excellent $104,560 |
| Brazilians | 88.6 /100 | #135 | Excellent $104,408 |
| Taiwanese | 87.4 /100 | #136 | Excellent $104,180 |
| Hungarians | 85.8 /100 | #137 | Excellent $103,913 |
| Ethiopians | 84.7 /100 | #138 | Excellent $103,736 |
| Immigrants | Oceania | 84.5 /100 | #139 | Excellent $103,705 |
| Norwegians | 84.3 /100 | #140 | Excellent $103,682 |
| Immigrants | Uganda | 83.7 /100 | #141 | Excellent $103,584 |
| Luxembourgers | 83.3 /100 | #142 | Excellent $103,536 |
| Serbians | 83.2 /100 | #143 | Excellent $103,522 |
| Czechs | 83.1 /100 | #144 | Excellent $103,507 |
| Ugandans | 82.9 /100 | #145 | Excellent $103,472 |
| Immigrants | Chile | 82.5 /100 | #146 | Excellent $103,412 |
| Basques | 82.3 /100 | #147 | Excellent $103,387 |
Demographics Similar to Northern Europeans by Householder Income Ages 45 - 64 years
In terms of householder income ages 45 - 64 years, the demographic groups most similar to Northern Europeans are Immigrants from Southern Europe ($107,775, a difference of 0.090%), Palestinian ($107,721, a difference of 0.14%), Immigrants from Serbia ($107,569, a difference of 0.28%), Sri Lankan ($108,270, a difference of 0.37%), and Immigrants from Hungary ($108,267, a difference of 0.37%).
| Demographics | Rating | Rank | Householder Income Ages 45 - 64 years |
| Immigrants | Philippines | 98.3 /100 | #90 | Exceptional $108,471 |
| Immigrants | Lebanon | 98.3 /100 | #91 | Exceptional $108,471 |
| Croatians | 98.3 /100 | #92 | Exceptional $108,383 |
| Immigrants | Croatia | 98.2 /100 | #93 | Exceptional $108,304 |
| Sri Lankans | 98.2 /100 | #94 | Exceptional $108,270 |
| Immigrants | Hungary | 98.2 /100 | #95 | Exceptional $108,267 |
| Immigrants | Argentina | 98.2 /100 | #96 | Exceptional $108,264 |
| Northern Europeans | 97.8 /100 | #97 | Exceptional $107,870 |
| Immigrants | Southern Europe | 97.7 /100 | #98 | Exceptional $107,775 |
| Palestinians | 97.6 /100 | #99 | Exceptional $107,721 |
| Immigrants | Serbia | 97.4 /100 | #100 | Exceptional $107,569 |
| Immigrants | Kazakhstan | 97.2 /100 | #101 | Exceptional $107,378 |
| Immigrants | Moldova | 97.1 /100 | #102 | Exceptional $107,357 |
| Syrians | 96.9 /100 | #103 | Exceptional $107,207 |
| Immigrants | Ukraine | 96.7 /100 | #104 | Exceptional $107,079 |