Yakama vs Immigrants from Kazakhstan Family Households with Children
COMPARE
Yakama
Immigrants from Kazakhstan
Family Households with Children
Family Households with Children Comparison
Yakama
Immigrants from Kazakhstan
30.8%
FAMILY HOUSEHOLDS WITH CHILDREN
100.0/ 100
METRIC RATING
8th/ 347
METRIC RANK
26.9%
FAMILY HOUSEHOLDS WITH CHILDREN
2.2/ 100
METRIC RATING
248th/ 347
METRIC RANK
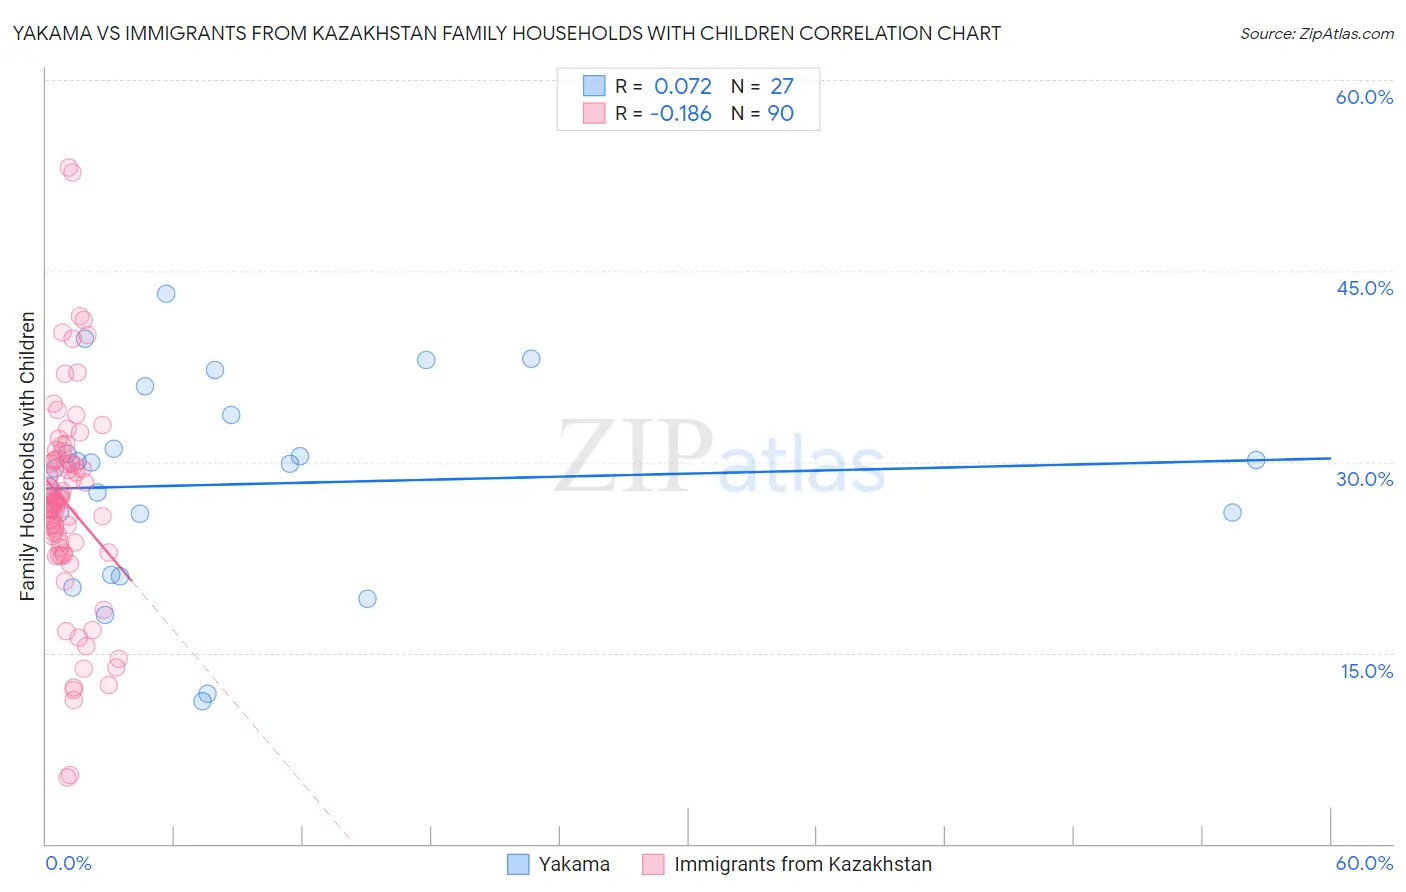
Yakama vs Immigrants from Kazakhstan Family Households with Children Correlation Chart
The statistical analysis conducted on geographies consisting of 19,917,879 people shows a slight positive correlation between the proportion of Yakama and percentage of family households with children in the United States with a correlation coefficient (R) of 0.072 and weighted average of 30.8%. Similarly, the statistical analysis conducted on geographies consisting of 124,425,181 people shows a poor negative correlation between the proportion of Immigrants from Kazakhstan and percentage of family households with children in the United States with a correlation coefficient (R) of -0.186 and weighted average of 26.9%, a difference of 14.5%.
Family Households with Children Correlation Summary
| Measurement | Yakama | Immigrants from Kazakhstan |
| Minimum | 11.2% | 5.2% |
| Maximum | 43.2% | 53.2% |
| Range | 32.0% | 48.0% |
| Mean | 28.3% | 26.7% |
| Median | 29.9% | 26.8% |
| Interquartile 25% (IQ1) | 21.1% | 23.3% |
| Interquartile 75% (IQ3) | 33.7% | 30.0% |
| Interquartile Range (IQR) | 12.6% | 6.7% |
| Standard Deviation (Sample) | 8.0% | 8.2% |
| Standard Deviation (Population) | 7.9% | 8.2% |
Similar Demographics by Family Households with Children
Demographics Similar to Yakama by Family Households with Children
In terms of family households with children, the demographic groups most similar to Yakama are Thai (30.6%, a difference of 0.48%), Immigrants from Central America (31.0%, a difference of 0.57%), Immigrants from Fiji (30.5%, a difference of 0.80%), Immigrants from India (31.0%, a difference of 0.87%), and Nepalese (30.5%, a difference of 0.88%).
| Demographics | Rating | Rank | Family Households with Children |
| Yup'ik | 100 /100 | #1 | Exceptional 37.0% |
| Inupiat | 100 /100 | #2 | Exceptional 32.8% |
| Immigrants | Mexico | 100.0 /100 | #3 | Exceptional 31.6% |
| Mexicans | 100.0 /100 | #4 | Exceptional 31.4% |
| Tongans | 100.0 /100 | #5 | Exceptional 31.2% |
| Immigrants | India | 100.0 /100 | #6 | Exceptional 31.0% |
| Immigrants | Central America | 100.0 /100 | #7 | Exceptional 31.0% |
| Yakama | 100.0 /100 | #8 | Exceptional 30.8% |
| Thais | 100.0 /100 | #9 | Exceptional 30.6% |
| Immigrants | Fiji | 100.0 /100 | #10 | Exceptional 30.5% |
| Nepalese | 100.0 /100 | #11 | Exceptional 30.5% |
| Immigrants | Pakistan | 100.0 /100 | #12 | Exceptional 30.2% |
| Afghans | 100.0 /100 | #13 | Exceptional 30.2% |
| Bangladeshis | 100.0 /100 | #14 | Exceptional 30.1% |
| Immigrants | South Central Asia | 100.0 /100 | #15 | Exceptional 30.0% |
Demographics Similar to Immigrants from Kazakhstan by Family Households with Children
In terms of family households with children, the demographic groups most similar to Immigrants from Kazakhstan are Potawatomi (26.9%, a difference of 0.010%), Immigrants from Eastern Europe (26.9%, a difference of 0.020%), Belgian (26.9%, a difference of 0.020%), Jamaican (26.9%, a difference of 0.070%), and Immigrants from Bosnia and Herzegovina (26.8%, a difference of 0.080%).
| Demographics | Rating | Rank | Family Households with Children |
| Navajo | 3.2 /100 | #241 | Tragic 26.9% |
| Immigrants | England | 3.2 /100 | #242 | Tragic 26.9% |
| Immigrants | Saudi Arabia | 2.9 /100 | #243 | Tragic 26.9% |
| Ukrainians | 2.9 /100 | #244 | Tragic 26.9% |
| Australians | 2.8 /100 | #245 | Tragic 26.9% |
| Jamaicans | 2.5 /100 | #246 | Tragic 26.9% |
| Potawatomi | 2.2 /100 | #247 | Tragic 26.9% |
| Immigrants | Kazakhstan | 2.2 /100 | #248 | Tragic 26.9% |
| Immigrants | Eastern Europe | 2.1 /100 | #249 | Tragic 26.9% |
| Belgians | 2.1 /100 | #250 | Tragic 26.9% |
| Immigrants | Bosnia and Herzegovina | 1.9 /100 | #251 | Tragic 26.8% |
| Irish | 1.8 /100 | #252 | Tragic 26.8% |
| Italians | 1.5 /100 | #253 | Tragic 26.8% |
| Immigrants | Scotland | 1.5 /100 | #254 | Tragic 26.8% |
| German Russians | 1.5 /100 | #255 | Tragic 26.8% |