Venezuelan vs Chickasaw Divorced or Separated
COMPARE
Venezuelan
Chickasaw
Divorced or Separated
Divorced or Separated Comparison
Venezuelans
Chickasaw
13.0%
DIVORCED OR SEPARATED
0.0/ 100
METRIC RATING
298th/ 347
METRIC RANK
14.2%
DIVORCED OR SEPARATED
0.0/ 100
METRIC RATING
340th/ 347
METRIC RANK
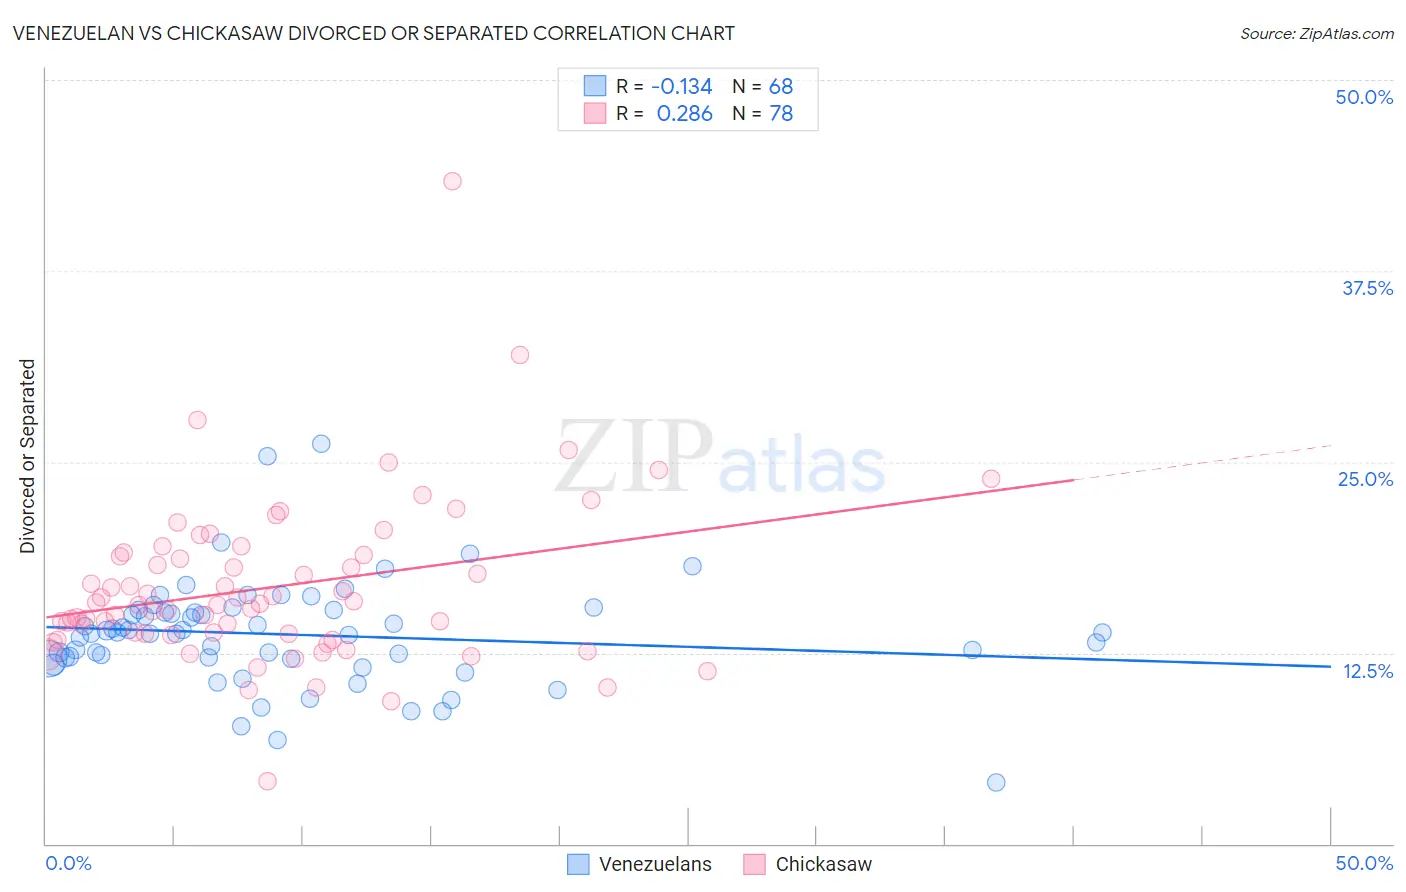
Venezuelan vs Chickasaw Divorced or Separated Correlation Chart
The statistical analysis conducted on geographies consisting of 306,203,759 people shows a poor negative correlation between the proportion of Venezuelans and percentage of population currently divorced or separated in the United States with a correlation coefficient (R) of -0.134 and weighted average of 13.0%. Similarly, the statistical analysis conducted on geographies consisting of 147,714,015 people shows a weak positive correlation between the proportion of Chickasaw and percentage of population currently divorced or separated in the United States with a correlation coefficient (R) of 0.286 and weighted average of 14.2%, a difference of 9.1%.
Divorced or Separated Correlation Summary
| Measurement | Venezuelan | Chickasaw |
| Minimum | 4.0% | 4.1% |
| Maximum | 26.2% | 43.4% |
| Range | 22.2% | 39.3% |
| Mean | 13.7% | 16.8% |
| Median | 13.8% | 15.7% |
| Interquartile 25% (IQ1) | 12.2% | 13.8% |
| Interquartile 75% (IQ3) | 15.2% | 18.9% |
| Interquartile Range (IQR) | 3.0% | 5.1% |
| Standard Deviation (Sample) | 3.5% | 5.4% |
| Standard Deviation (Population) | 3.5% | 5.4% |
Similar Demographics by Divorced or Separated
Demographics Similar to Venezuelans by Divorced or Separated
In terms of divorced or separated, the demographic groups most similar to Venezuelans are Immigrants from Jamaica (13.0%, a difference of 0.040%), Native/Alaskan (13.0%, a difference of 0.070%), Nicaraguan (13.0%, a difference of 0.12%), Celtic (13.0%, a difference of 0.54%), and Immigrants from Cabo Verde (13.1%, a difference of 0.59%).
| Demographics | Rating | Rank | Divorced or Separated |
| Immigrants | Honduras | 0.0 /100 | #291 | Tragic 12.9% |
| Scotch-Irish | 0.0 /100 | #292 | Tragic 12.9% |
| Jamaicans | 0.0 /100 | #293 | Tragic 12.9% |
| Apache | 0.0 /100 | #294 | Tragic 12.9% |
| Celtics | 0.0 /100 | #295 | Tragic 13.0% |
| Nicaraguans | 0.0 /100 | #296 | Tragic 13.0% |
| Natives/Alaskans | 0.0 /100 | #297 | Tragic 13.0% |
| Venezuelans | 0.0 /100 | #298 | Tragic 13.0% |
| Immigrants | Jamaica | 0.0 /100 | #299 | Tragic 13.0% |
| Immigrants | Cabo Verde | 0.0 /100 | #300 | Tragic 13.1% |
| Alaskan Athabascans | 0.0 /100 | #301 | Tragic 13.1% |
| Immigrants | Venezuela | 0.0 /100 | #302 | Tragic 13.1% |
| Cape Verdeans | 0.0 /100 | #303 | Tragic 13.1% |
| Hopi | 0.0 /100 | #304 | Tragic 13.2% |
| Chippewa | 0.0 /100 | #305 | Tragic 13.2% |
Demographics Similar to Chickasaw by Divorced or Separated
In terms of divorced or separated, the demographic groups most similar to Chickasaw are Colville (14.2%, a difference of 0.040%), Bahamian (14.2%, a difference of 0.20%), Seminole (14.3%, a difference of 0.36%), Choctaw (14.1%, a difference of 0.57%), and Crow (14.1%, a difference of 0.88%).
| Demographics | Rating | Rank | Divorced or Separated |
| Puerto Ricans | 0.0 /100 | #333 | Tragic 13.9% |
| Immigrants | Bahamas | 0.0 /100 | #334 | Tragic 13.9% |
| Dutch West Indians | 0.0 /100 | #335 | Tragic 14.0% |
| Shoshone | 0.0 /100 | #336 | Tragic 14.0% |
| Crow | 0.0 /100 | #337 | Tragic 14.1% |
| Choctaw | 0.0 /100 | #338 | Tragic 14.1% |
| Colville | 0.0 /100 | #339 | Tragic 14.2% |
| Chickasaw | 0.0 /100 | #340 | Tragic 14.2% |
| Bahamians | 0.0 /100 | #341 | Tragic 14.2% |
| Seminole | 0.0 /100 | #342 | Tragic 14.3% |
| Creek | 0.0 /100 | #343 | Tragic 14.4% |
| Cubans | 0.0 /100 | #344 | Tragic 14.5% |
| Kiowa | 0.0 /100 | #345 | Tragic 14.5% |
| Arapaho | 0.0 /100 | #346 | Tragic 14.8% |
| Immigrants | Cuba | 0.0 /100 | #347 | Tragic 15.2% |