Immigrants from Brazil vs Immigrants from Germany Family Households with Children

COMPARE

Immigrants from Brazil
Race
Ancestry
AfghanAfricanAlaska NativeAlaskan AthabascanAlbanianAleutAlsatianAmericanApacheArabArapahoArgentineanArmenianAssyrian/Chaldean/SyriacAustralianAustrianBahamianBangladeshiBarbadianBasqueBelgianBelizeanBermudanBhutaneseBlackfeetBolivianBrazilianBritishBritish West IndianBulgarianBurmeseCajunCambodianCanadianCape VerdeanCarpatho RusynCelticCentral AmericanCentral American IndianCherokeeCheyenneChickasawChileanChineseChippewaChoctawColombianColvilleComancheCosta RicanCreeCreekCroatianCrowCubanCypriotCzechCzechoslovakianDanishDelawareDominicanDutchDutch West IndianEastern EuropeanEcuadorianEgyptianEnglishEstonianEthiopianEuropeanFijianFilipinoFinnishFrenchFrench American IndianFrench CanadianGermanGerman RussianGhanaianGreekGuamanian/ChamorroGuatemalanGuyaneseHaitianHmongHonduranHopiHoumaHungarianIcelanderIndian (Asian)IndonesianInupiatIranianIraqiIrishIroquoisIsraeliItalianJamaicanJapaneseJordanianKenyanKiowaKoreanLaotianLatvianLebaneseLiberianLithuanianLumbeeLuxembourgerMacedonianMalaysianMalteseMarshalleseMenomineeMexicanMexican American IndianMongolianMoroccanNative HawaiianNavajoNepaleseNew ZealanderNicaraguanNigerianNorthern EuropeanNorwegianOkinawanOsageOttawaPaiutePakistaniPalestinianPanamanianParaguayanPennsylvania GermanPeruvianPimaPolishPortuguesePotawatomiPuebloPuerto RicanPuget Sound SalishRomanianRussianSalvadoranSamoanScandinavianScotch-IrishScottishSeminoleSenegaleseSerbianShoshoneSierra LeoneanSiouxSlavicSlovakSloveneSomaliSouth AfricanSouth AmericanSouth American IndianSoviet UnionSpaniardSpanishSpanish AmericanSpanish American IndianSri LankanSubsaharan AfricanSudaneseSwedishSwissSyrianTaiwaneseThaiTlingit-HaidaTohono O'OdhamTonganTrinidadian and TobagonianTsimshianTurkishU.S. Virgin IslanderUgandanUkrainianUruguayanUteVenezuelanVietnameseWelshWest IndianYakamaYaquiYugoslavianYumanYup'ikZimbabwean
Immigration
NonimmigrantsImmigrantsAfghanistanAfricaAlbaniaArgentinaArmeniaAsiaAustraliaAustriaBahamasBangladeshBarbadosBelarusBelgiumBelizeBoliviaBosnia and HerzegovinaBrazilBulgariaBurma/MyanmarCabo VerdeCambodiaCameroonCanadaCaribbeanCentral AmericaChileChinaColombiaCongoCosta RicaCroatiaCubaCzechoslovakiaDenmarkDominicaDominican RepublicEastern AfricaEastern AsiaEastern EuropeEcuadorEgyptEl SalvadorEnglandEritreaEthiopiaEuropeFijiFranceGhanaGreeceGrenadaGuatemalaGuyanaHaitiHondurasHong KongHungaryIndiaIndonesiaIranIraqIrelandIsraelItalyJamaicaJapanJordanKazakhstanKenyaKoreaKuwaitLaosLatin AmericaLatviaLebanonLiberiaLithuaniaMalaysiaMexicoMicronesiaMiddle AfricaMoldovaMoroccoNepalNetherlandsNicaraguaNigeriaNorth AmericaNorth MacedoniaNorthern AfricaNorthern EuropeNorwayOceaniaPakistanPanamaPeruPhilippinesPolandPortugalRomaniaRussiaSaudi ArabiaScotlandSenegalSerbiaSierra LeoneSingaporeSomaliaSouth AfricaSouth AmericaSouth Central AsiaSouth Eastern AsiaSouthern EuropeSpainSri LankaSt. Vincent and the GrenadinesSudanSwedenSwitzerlandSyriaTaiwanThailandTrinidad and TobagoTurkeyUgandaUkraineUruguayUzbekistanVenezuelaVietnamWest IndiesWestern AfricaWestern AsiaWestern EuropeYemenZaireZimbabweAzores
Immigrants from Germany
Race
Ancestry
AfghanAfricanAlaska NativeAlaskan AthabascanAlbanianAleutAlsatianAmericanApacheArabArapahoArgentineanArmenianAssyrian/Chaldean/SyriacAustralianAustrianBahamianBangladeshiBarbadianBasqueBelgianBelizeanBermudanBhutaneseBlackfeetBolivianBrazilianBritishBritish West IndianBulgarianBurmeseCajunCambodianCanadianCape VerdeanCarpatho RusynCelticCentral AmericanCentral American IndianCherokeeCheyenneChickasawChileanChineseChippewaChoctawColombianColvilleComancheCosta RicanCreeCreekCroatianCrowCubanCypriotCzechCzechoslovakianDanishDelawareDominicanDutchDutch West IndianEastern EuropeanEcuadorianEgyptianEnglishEstonianEthiopianEuropeanFijianFilipinoFinnishFrenchFrench American IndianFrench CanadianGermanGerman RussianGhanaianGreekGuamanian/ChamorroGuatemalanGuyaneseHaitianHmongHonduranHopiHoumaHungarianIcelanderIndian (Asian)IndonesianInupiatIranianIraqiIrishIroquoisIsraeliItalianJamaicanJapaneseJordanianKenyanKiowaKoreanLaotianLatvianLebaneseLiberianLithuanianLumbeeLuxembourgerMacedonianMalaysianMalteseMarshalleseMenomineeMexicanMexican American IndianMongolianMoroccanNative HawaiianNavajoNepaleseNew ZealanderNicaraguanNigerianNorthern EuropeanNorwegianOkinawanOsageOttawaPaiutePakistaniPalestinianPanamanianParaguayanPennsylvania GermanPeruvianPimaPolishPortuguesePotawatomiPuebloPuerto RicanPuget Sound SalishRomanianRussianSalvadoranSamoanScandinavianScotch-IrishScottishSeminoleSenegaleseSerbianShoshoneSierra LeoneanSiouxSlavicSlovakSloveneSomaliSouth AfricanSouth AmericanSouth American IndianSoviet UnionSpaniardSpanishSpanish AmericanSpanish American IndianSri LankanSubsaharan AfricanSudaneseSwedishSwissSyrianTaiwaneseThaiTlingit-HaidaTohono O'OdhamTonganTrinidadian and TobagonianTsimshianTurkishU.S. Virgin IslanderUgandanUkrainianUruguayanUteVenezuelanVietnameseWelshWest IndianYakamaYaquiYugoslavianYumanYup'ikZimbabwean
Immigration
NonimmigrantsImmigrantsAfghanistanAfricaAlbaniaArgentinaArmeniaAsiaAustraliaAustriaBahamasBangladeshBarbadosBelarusBelgiumBelizeBoliviaBosnia and HerzegovinaBulgariaBurma/MyanmarCabo VerdeCambodiaCameroonCanadaCaribbeanCentral AmericaChileChinaColombiaCongoCosta RicaCroatiaCubaCzechoslovakiaDenmarkDominicaDominican RepublicEastern AfricaEastern AsiaEastern EuropeEcuadorEgyptEl SalvadorEnglandEritreaEthiopiaEuropeFijiFranceGermanyGhanaGreeceGrenadaGuatemalaGuyanaHaitiHondurasHong KongHungaryIndiaIndonesiaIranIraqIrelandIsraelItalyJamaicaJapanJordanKazakhstanKenyaKoreaKuwaitLaosLatin AmericaLatviaLebanonLiberiaLithuaniaMalaysiaMexicoMicronesiaMiddle AfricaMoldovaMoroccoNepalNetherlandsNicaraguaNigeriaNorth AmericaNorth MacedoniaNorthern AfricaNorthern EuropeNorwayOceaniaPakistanPanamaPeruPhilippinesPolandPortugalRomaniaRussiaSaudi ArabiaScotlandSenegalSerbiaSierra LeoneSingaporeSomaliaSouth AfricaSouth AmericaSouth Central AsiaSouth Eastern AsiaSouthern EuropeSpainSri LankaSt. Vincent and the GrenadinesSudanSwedenSwitzerlandSyriaTaiwanThailandTrinidad and TobagoTurkeyUgandaUkraineUruguayUzbekistanVenezuelaVietnamWest IndiesWestern AfricaWestern AsiaWestern EuropeYemenZaireZimbabweAzores
Family Households with Children
Income
Poverty
Unemployment
Labor Participation
Family Structure
Vehicle Availability
Education Level
Disability

Family Households with Children Comparison

Immigrants from Brazil

Immigrants from Germany

Average
Tragic
27.4%
FAMILY HOUSEHOLDS WITH CHILDREN
40.6/ 100
METRIC RATING
186th/ 347
METRIC RANK
27.0%
FAMILY HOUSEHOLDS WITH CHILDREN
4.4/ 100
METRIC RATING
234th/ 347
METRIC RANK

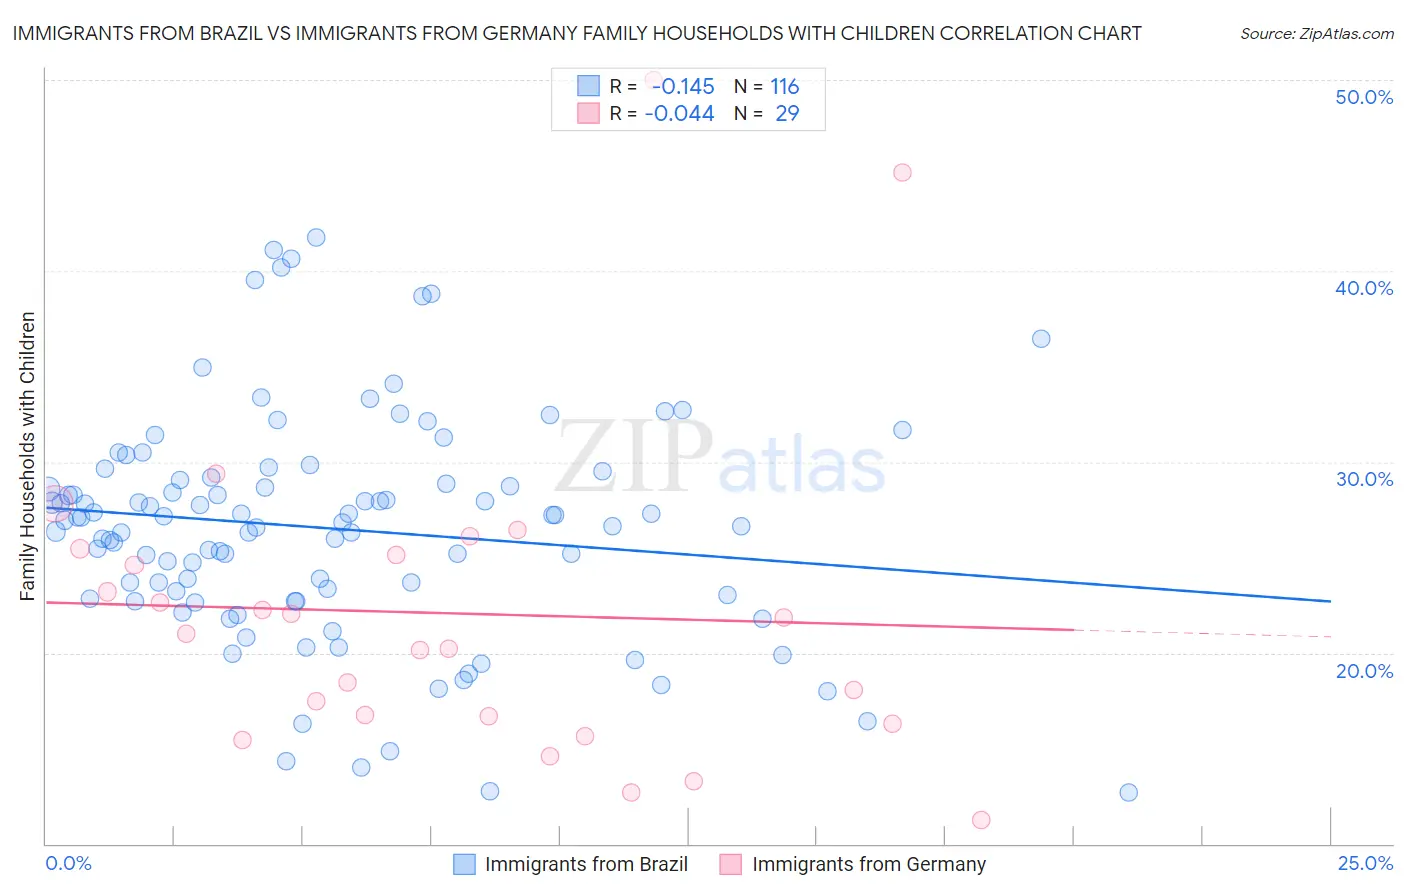
Immigrants from Brazil vs Immigrants from Germany Family Households with Children Correlation Chart

The statistical analysis conducted on geographies consisting of 342,742,335 people shows a poor negative correlation between the proportion of Immigrants from Brazil and percentage of family households with children in the United States with a correlation coefficient (R) of -0.145 and weighted average of 27.4%. Similarly, the statistical analysis conducted on geographies consisting of 463,563,782 people shows no correlation between the proportion of Immigrants from Germany and percentage of family households with children in the United States with a correlation coefficient (R) of -0.044 and weighted average of 27.0%, a difference of 1.5%.
Immigrants from Brazil vs Immigrants from Germany Family Households with Children

Family Households with Children Correlation Summary

MeasurementImmigrants from BrazilImmigrants from Germany
Minimum12.7%11.3%
Maximum41.7%50.0%
Range29.1%38.7%
Mean26.5%22.1%
Median26.9%21.0%
Interquartile 25% (IQ1)22.9%16.5%
Interquartile 75% (IQ3)29.1%25.3%
Interquartile Range (IQR)6.2%8.8%
Standard Deviation (Sample)5.9%8.5%
Standard Deviation (Population)5.9%8.4%

Similar Demographics by Family Households with Children

Demographics Similar to Immigrants from Brazil by Family Households with Children

In terms of family households with children, the demographic groups most similar to Immigrants from Brazil are Creek (27.4%, a difference of 0.020%), Delaware (27.4%, a difference of 0.030%), Dutch (27.4%, a difference of 0.040%), Immigrants from Israel (27.4%, a difference of 0.060%), and Immigrants from Uruguay (27.4%, a difference of 0.070%).
DemographicsRating | RankFamily Households with Children
Turks
46.9
/100
|
#179
Average
27.4%
Immigrants | Turkey
46.9
/100
|
#180
Average
27.4%
Aleuts
46.7
/100
|
#181
Average
27.4%
Puget Sound Salish
46.2
/100
|
#182
Average
27.4%
South Africans
44.9
/100
|
#183
Average
27.4%
Native Hawaiians
44.6
/100
|
#184
Average
27.4%
Delaware
42.0
/100
|
#185
Average
27.4%
Immigrants | Brazil
40.6
/100
|
#186
Average
27.4%
Creek
39.8
/100
|
#187
Fair
27.4%
Dutch
38.8
/100
|
#188
Fair
27.4%
Immigrants | Israel
37.9
/100
|
#189
Fair
27.4%
Immigrants | Uruguay
37.7
/100
|
#190
Fair
27.4%
Sudanese
37.6
/100
|
#191
Fair
27.4%
Pennsylvania Germans
37.5
/100
|
#192
Fair
27.4%
Swedes
36.9
/100
|
#193
Fair
27.4%

Demographics Similar to Immigrants from Germany by Family Households with Children

In terms of family households with children, the demographic groups most similar to Immigrants from Germany are Immigrants from Morocco (27.0%, a difference of 0.040%), Yugoslavian (27.0%, a difference of 0.080%), Immigrants from Italy (27.0%, a difference of 0.080%), Luxembourger (27.0%, a difference of 0.13%), and Cape Verdean (26.9%, a difference of 0.13%).
DemographicsRating | RankFamily Households with Children
Tsimshian
6.6
/100
|
#227
Tragic
27.0%
Scottish
6.5
/100
|
#228
Tragic
27.0%
Immigrants | Caribbean
6.3
/100
|
#229
Tragic
27.0%
Bulgarians
5.8
/100
|
#230
Tragic
27.0%
Luxembourgers
5.5
/100
|
#231
Tragic
27.0%
Yugoslavians
5.1
/100
|
#232
Tragic
27.0%
Immigrants | Italy
5.0
/100
|
#233
Tragic
27.0%
Immigrants | Germany
4.4
/100
|
#234
Tragic
27.0%
Immigrants | Morocco
4.2
/100
|
#235
Tragic
27.0%
Cape Verdeans
3.6
/100
|
#236
Tragic
26.9%
Immigrants | Netherlands
3.5
/100
|
#237
Tragic
26.9%
Moroccans
3.4
/100
|
#238
Tragic
26.9%
Immigrants | Southern Europe
3.4
/100
|
#239
Tragic
26.9%
Immigrants | Bulgaria
3.3
/100
|
#240
Tragic
26.9%
Navajo
3.2
/100
|
#241
Tragic
26.9%