Turkish vs Icelander Single Father Households
COMPARE
Turkish
Icelander
Single Father Households
Single Father Households Comparison
Turks
Icelanders
2.0%
SINGLE FATHER HOUSEHOLDS
100.0/ 100
METRIC RATING
33rd/ 347
METRIC RANK
2.3%
SINGLE FATHER HOUSEHOLDS
63.1/ 100
METRIC RATING
168th/ 347
METRIC RANK
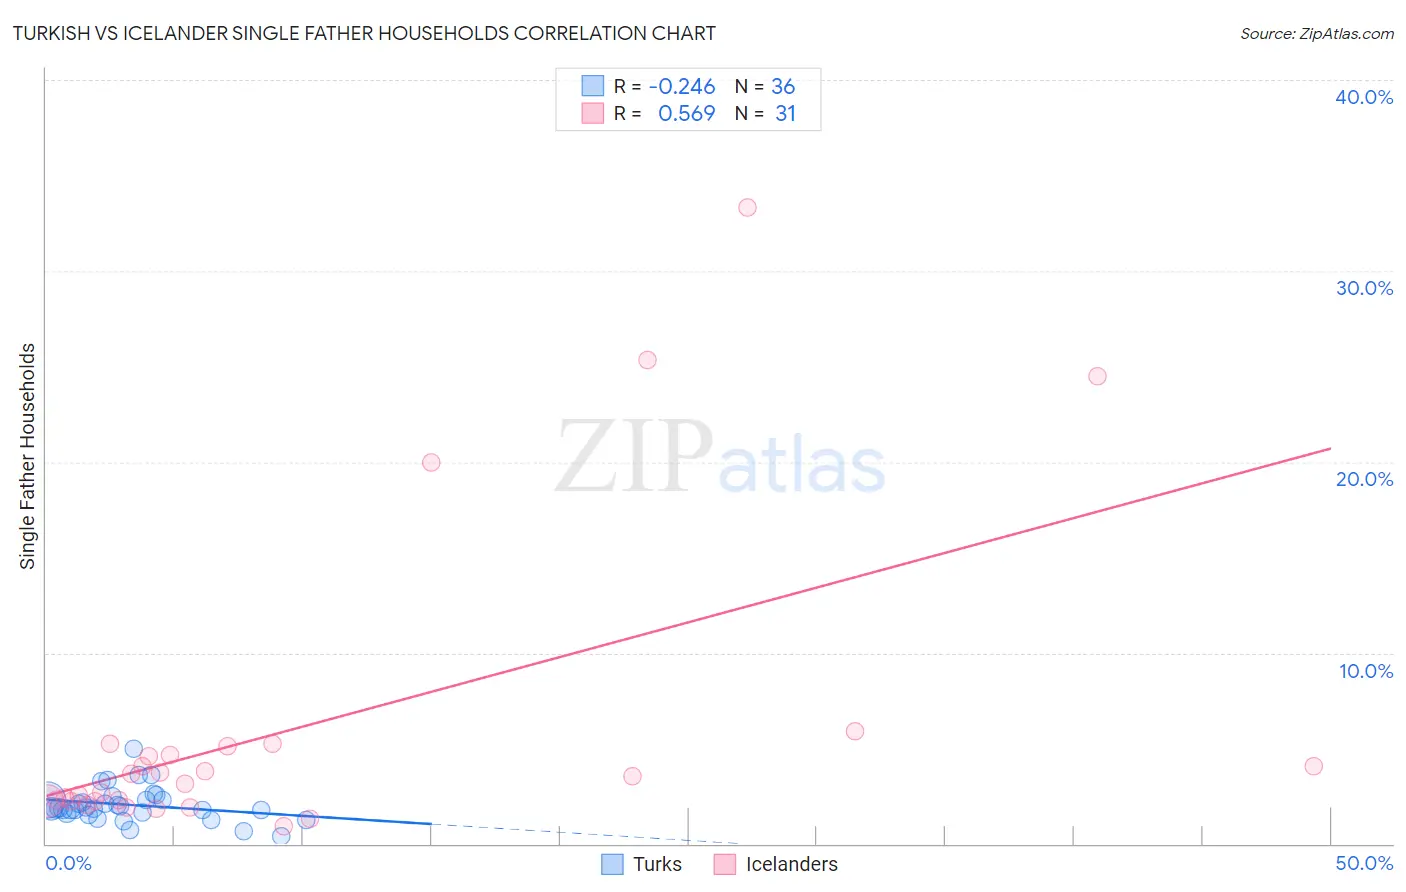
Turkish vs Icelander Single Father Households Correlation Chart
The statistical analysis conducted on geographies consisting of 270,298,276 people shows a weak negative correlation between the proportion of Turks and percentage of single father households in the United States with a correlation coefficient (R) of -0.246 and weighted average of 2.0%. Similarly, the statistical analysis conducted on geographies consisting of 159,015,107 people shows a substantial positive correlation between the proportion of Icelanders and percentage of single father households in the United States with a correlation coefficient (R) of 0.569 and weighted average of 2.3%, a difference of 17.1%.
Single Father Households Correlation Summary
| Measurement | Turkish | Icelander |
| Minimum | 0.37% | 0.94% |
| Maximum | 5.0% | 33.3% |
| Range | 4.6% | 32.4% |
| Mean | 2.0% | 6.1% |
| Median | 1.9% | 3.5% |
| Interquartile 25% (IQ1) | 1.6% | 2.2% |
| Interquartile 75% (IQ3) | 2.3% | 5.1% |
| Interquartile Range (IQR) | 0.70% | 2.9% |
| Standard Deviation (Sample) | 0.89% | 8.0% |
| Standard Deviation (Population) | 0.88% | 7.9% |
Similar Demographics by Single Father Households
Demographics Similar to Turks by Single Father Households
In terms of single father households, the demographic groups most similar to Turks are Immigrants from Australia (2.0%, a difference of 0.020%), Chinese (2.0%, a difference of 0.21%), Israeli (2.0%, a difference of 0.25%), Cambodian (2.0%, a difference of 0.28%), and Bulgarian (2.0%, a difference of 0.31%).
| Demographics | Rating | Rank | Single Father Households |
| Assyrians/Chaldeans/Syriacs | 100.0 /100 | #26 | Exceptional 2.0% |
| Immigrants | South Central Asia | 100.0 /100 | #27 | Exceptional 2.0% |
| Immigrants | Japan | 100.0 /100 | #28 | Exceptional 2.0% |
| Bulgarians | 100.0 /100 | #29 | Exceptional 2.0% |
| Cambodians | 100.0 /100 | #30 | Exceptional 2.0% |
| Israelis | 100.0 /100 | #31 | Exceptional 2.0% |
| Chinese | 100.0 /100 | #32 | Exceptional 2.0% |
| Turks | 100.0 /100 | #33 | Exceptional 2.0% |
| Immigrants | Australia | 100.0 /100 | #34 | Exceptional 2.0% |
| Albanians | 100.0 /100 | #35 | Exceptional 2.0% |
| Immigrants | Belgium | 100.0 /100 | #36 | Exceptional 2.0% |
| Immigrants | St. Vincent and the Grenadines | 100.0 /100 | #37 | Exceptional 2.0% |
| Immigrants | Eastern Europe | 100.0 /100 | #38 | Exceptional 2.0% |
| Immigrants | Sri Lanka | 100.0 /100 | #39 | Exceptional 2.0% |
| Immigrants | Bulgaria | 100.0 /100 | #40 | Exceptional 2.0% |
Demographics Similar to Icelanders by Single Father Households
In terms of single father households, the demographic groups most similar to Icelanders are Czech (2.3%, a difference of 0.040%), Ugandan (2.3%, a difference of 0.070%), South American (2.3%, a difference of 0.10%), Swedish (2.3%, a difference of 0.12%), and Czechoslovakian (2.3%, a difference of 0.33%).
| Demographics | Rating | Rank | Single Father Households |
| Swiss | 73.2 /100 | #161 | Good 2.3% |
| Scottish | 72.8 /100 | #162 | Good 2.3% |
| Irish | 72.1 /100 | #163 | Good 2.3% |
| Pakistanis | 70.6 /100 | #164 | Good 2.3% |
| Scotch-Irish | 69.4 /100 | #165 | Good 2.3% |
| English | 68.6 /100 | #166 | Good 2.3% |
| South Americans | 64.3 /100 | #167 | Good 2.3% |
| Icelanders | 63.1 /100 | #168 | Good 2.3% |
| Czechs | 62.5 /100 | #169 | Good 2.3% |
| Ugandans | 62.2 /100 | #170 | Good 2.3% |
| Swedes | 61.6 /100 | #171 | Good 2.3% |
| Czechoslovakians | 58.9 /100 | #172 | Average 2.3% |
| Celtics | 55.4 /100 | #173 | Average 2.3% |
| Afghans | 50.0 /100 | #174 | Average 2.3% |
| Immigrants | Jamaica | 49.1 /100 | #175 | Average 2.3% |