Turkish vs Alaskan Athabascan Currently Married
COMPARE
Turkish
Alaskan Athabascan
Currently Married
Currently Married Comparison
Turks
Alaskan Athabascans
47.8%
CURRENTLY MARRIED
93.9/ 100
METRIC RATING
102nd/ 347
METRIC RANK
44.6%
CURRENTLY MARRIED
0.9/ 100
METRIC RATING
235th/ 347
METRIC RANK
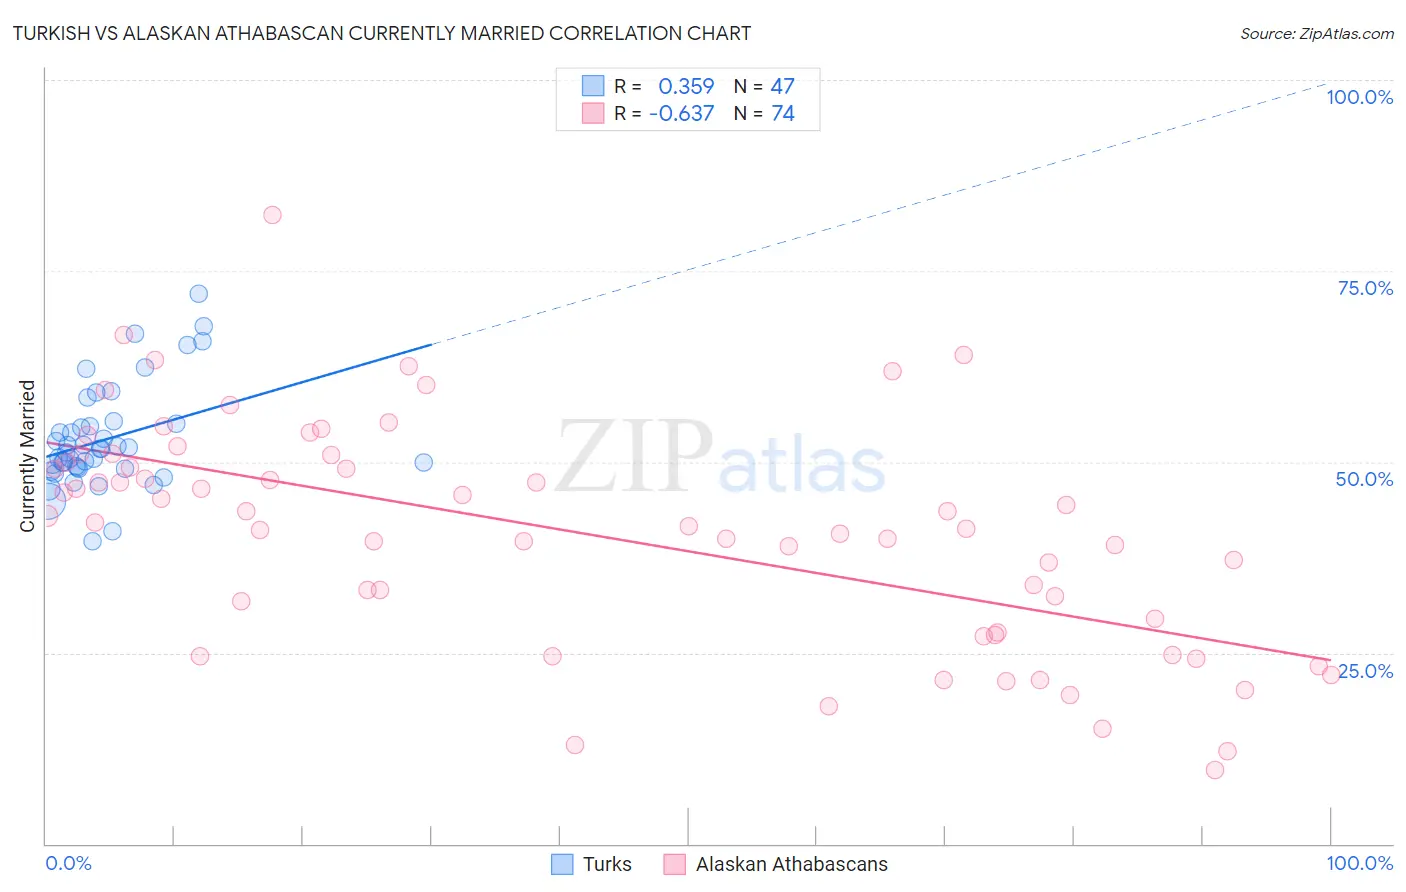
Turkish vs Alaskan Athabascan Currently Married Correlation Chart
The statistical analysis conducted on geographies consisting of 271,815,106 people shows a mild positive correlation between the proportion of Turks and percentage of population currently married in the United States with a correlation coefficient (R) of 0.359 and weighted average of 47.8%. Similarly, the statistical analysis conducted on geographies consisting of 45,820,219 people shows a significant negative correlation between the proportion of Alaskan Athabascans and percentage of population currently married in the United States with a correlation coefficient (R) of -0.637 and weighted average of 44.6%, a difference of 7.1%.
Currently Married Correlation Summary
| Measurement | Turkish | Alaskan Athabascan |
| Minimum | 39.7% | 9.6% |
| Maximum | 72.0% | 82.4% |
| Range | 32.3% | 72.8% |
| Mean | 53.0% | 40.6% |
| Median | 51.8% | 41.9% |
| Interquartile 25% (IQ1) | 49.1% | 27.7% |
| Interquartile 75% (IQ3) | 55.0% | 49.9% |
| Interquartile Range (IQR) | 5.9% | 22.2% |
| Standard Deviation (Sample) | 6.8% | 14.7% |
| Standard Deviation (Population) | 6.7% | 14.6% |
Similar Demographics by Currently Married
Demographics Similar to Turks by Currently Married
In terms of currently married, the demographic groups most similar to Turks are Immigrants from Germany (47.8%, a difference of 0.020%), Cypriot (47.8%, a difference of 0.030%), Celtic (47.8%, a difference of 0.040%), Serbian (47.8%, a difference of 0.050%), and Immigrants from Sweden (47.8%, a difference of 0.060%).
| Demographics | Rating | Rank | Currently Married |
| Immigrants | Bulgaria | 94.8 /100 | #95 | Exceptional 47.9% |
| Egyptians | 94.8 /100 | #96 | Exceptional 47.9% |
| Immigrants | Ukraine | 94.8 /100 | #97 | Exceptional 47.9% |
| Immigrants | China | 94.7 /100 | #98 | Exceptional 47.9% |
| Immigrants | Sweden | 94.3 /100 | #99 | Exceptional 47.8% |
| Celtics | 94.2 /100 | #100 | Exceptional 47.8% |
| Immigrants | Germany | 94.1 /100 | #101 | Exceptional 47.8% |
| Turks | 93.9 /100 | #102 | Exceptional 47.8% |
| Cypriots | 93.7 /100 | #103 | Exceptional 47.8% |
| Serbians | 93.6 /100 | #104 | Exceptional 47.8% |
| Immigrants | Singapore | 93.3 /100 | #105 | Exceptional 47.8% |
| Immigrants | Greece | 93.1 /100 | #106 | Exceptional 47.7% |
| Immigrants | Italy | 92.9 /100 | #107 | Exceptional 47.7% |
| Tsimshian | 92.4 /100 | #108 | Exceptional 47.7% |
| Immigrants | Egypt | 92.3 /100 | #109 | Exceptional 47.7% |
Demographics Similar to Alaskan Athabascans by Currently Married
In terms of currently married, the demographic groups most similar to Alaskan Athabascans are Cuban (44.6%, a difference of 0.010%), Seminole (44.6%, a difference of 0.010%), Moroccan (44.6%, a difference of 0.090%), Immigrants from Saudi Arabia (44.7%, a difference of 0.16%), and Iroquois (44.7%, a difference of 0.16%).
| Demographics | Rating | Rank | Currently Married |
| Immigrants | Uruguay | 2.0 /100 | #228 | Tragic 45.0% |
| Cree | 1.7 /100 | #229 | Tragic 44.9% |
| Immigrants | Kenya | 1.6 /100 | #230 | Tragic 44.9% |
| Immigrants | Panama | 1.5 /100 | #231 | Tragic 44.9% |
| Nepalese | 1.2 /100 | #232 | Tragic 44.7% |
| Immigrants | Saudi Arabia | 1.1 /100 | #233 | Tragic 44.7% |
| Iroquois | 1.1 /100 | #234 | Tragic 44.7% |
| Alaskan Athabascans | 0.9 /100 | #235 | Tragic 44.6% |
| Cubans | 0.9 /100 | #236 | Tragic 44.6% |
| Seminole | 0.9 /100 | #237 | Tragic 44.6% |
| Moroccans | 0.9 /100 | #238 | Tragic 44.6% |
| Immigrants | Mexico | 0.7 /100 | #239 | Tragic 44.5% |
| Mexican American Indians | 0.7 /100 | #240 | Tragic 44.5% |
| Ethiopians | 0.7 /100 | #241 | Tragic 44.5% |
| Immigrants | Cambodia | 0.7 /100 | #242 | Tragic 44.5% |