Immigrants vs Spanish American Indian Divorced or Separated
COMPARE
Immigrants
Spanish American Indian
Divorced or Separated
Divorced or Separated Comparison
Immigrants
Spanish American Indians
11.8%
DIVORCED OR SEPARATED
93.7/ 100
METRIC RATING
123rd/ 347
METRIC RANK
11.6%
DIVORCED OR SEPARATED
99.0/ 100
METRIC RATING
91st/ 347
METRIC RANK
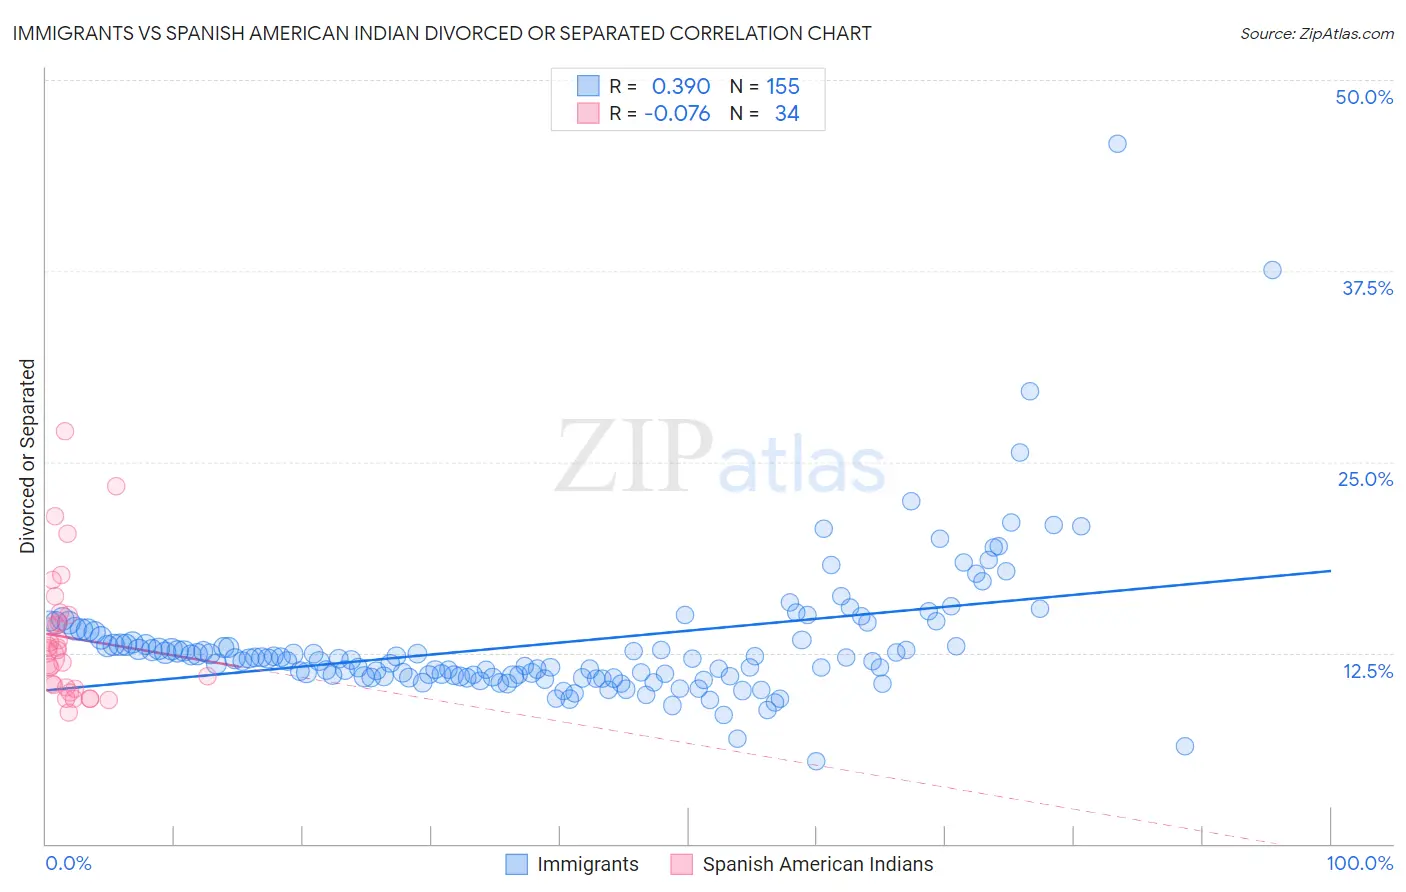
Immigrants vs Spanish American Indian Divorced or Separated Correlation Chart
The statistical analysis conducted on geographies consisting of 577,228,923 people shows a mild positive correlation between the proportion of Immigrants and percentage of population currently divorced or separated in the United States with a correlation coefficient (R) of 0.390 and weighted average of 11.8%. Similarly, the statistical analysis conducted on geographies consisting of 73,145,304 people shows a slight negative correlation between the proportion of Spanish American Indians and percentage of population currently divorced or separated in the United States with a correlation coefficient (R) of -0.076 and weighted average of 11.6%, a difference of 1.7%.
Divorced or Separated Correlation Summary
| Measurement | Immigrants | Spanish American Indian |
| Minimum | 5.4% | 8.6% |
| Maximum | 45.8% | 27.0% |
| Range | 40.4% | 18.4% |
| Mean | 13.1% | 13.5% |
| Median | 12.1% | 12.6% |
| Interquartile 25% (IQ1) | 10.9% | 10.2% |
| Interquartile 75% (IQ3) | 13.5% | 15.0% |
| Interquartile Range (IQR) | 2.6% | 4.8% |
| Standard Deviation (Sample) | 4.7% | 4.3% |
| Standard Deviation (Population) | 4.7% | 4.3% |
Similar Demographics by Divorced or Separated
Demographics Similar to Immigrants by Divorced or Separated
In terms of divorced or separated, the demographic groups most similar to Immigrants are Menominee (11.8%, a difference of 0.020%), Ugandan (11.8%, a difference of 0.080%), Romanian (11.8%, a difference of 0.13%), Iraqi (11.8%, a difference of 0.15%), and Ukrainian (11.8%, a difference of 0.19%).
| Demographics | Rating | Rank | Divorced or Separated |
| Immigrants | Iraq | 95.4 /100 | #116 | Exceptional 11.7% |
| Immigrants | Uganda | 95.3 /100 | #117 | Exceptional 11.7% |
| Ecuadorians | 95.3 /100 | #118 | Exceptional 11.7% |
| Syrians | 95.1 /100 | #119 | Exceptional 11.7% |
| Iraqis | 94.6 /100 | #120 | Exceptional 11.8% |
| Romanians | 94.5 /100 | #121 | Exceptional 11.8% |
| Menominee | 93.8 /100 | #122 | Exceptional 11.8% |
| Immigrants | Immigrants | 93.7 /100 | #123 | Exceptional 11.8% |
| Ugandans | 93.1 /100 | #124 | Exceptional 11.8% |
| Ukrainians | 92.3 /100 | #125 | Exceptional 11.8% |
| South American Indians | 92.1 /100 | #126 | Exceptional 11.8% |
| South Africans | 88.9 /100 | #127 | Excellent 11.8% |
| Immigrants | Ecuador | 88.9 /100 | #128 | Excellent 11.8% |
| Immigrants | St. Vincent and the Grenadines | 88.4 /100 | #129 | Excellent 11.8% |
| Immigrants | Austria | 88.2 /100 | #130 | Excellent 11.8% |
Demographics Similar to Spanish American Indians by Divorced or Separated
In terms of divorced or separated, the demographic groups most similar to Spanish American Indians are Zimbabwean (11.6%, a difference of 0.040%), Immigrants from Denmark (11.6%, a difference of 0.060%), Arab (11.6%, a difference of 0.060%), Immigrants from Fiji (11.6%, a difference of 0.070%), and Immigrants from Southern Europe (11.6%, a difference of 0.14%).
| Demographics | Rating | Rank | Divorced or Separated |
| Bulgarians | 99.3 /100 | #84 | Exceptional 11.5% |
| Immigrants | Albania | 99.3 /100 | #85 | Exceptional 11.5% |
| Immigrants | Latvia | 99.2 /100 | #86 | Exceptional 11.6% |
| Immigrants | Nepal | 99.2 /100 | #87 | Exceptional 11.6% |
| Immigrants | Europe | 99.2 /100 | #88 | Exceptional 11.6% |
| Immigrants | Southern Europe | 99.1 /100 | #89 | Exceptional 11.6% |
| Zimbabweans | 99.0 /100 | #90 | Exceptional 11.6% |
| Spanish American Indians | 99.0 /100 | #91 | Exceptional 11.6% |
| Immigrants | Denmark | 98.9 /100 | #92 | Exceptional 11.6% |
| Arabs | 98.9 /100 | #93 | Exceptional 11.6% |
| Immigrants | Fiji | 98.9 /100 | #94 | Exceptional 11.6% |
| Immigrants | Serbia | 98.8 /100 | #95 | Exceptional 11.6% |
| Immigrants | Ukraine | 98.7 /100 | #96 | Exceptional 11.6% |
| Latvians | 98.7 /100 | #97 | Exceptional 11.6% |
| Immigrants | Jordan | 98.6 /100 | #98 | Exceptional 11.6% |