Tohono O'odham vs Greek Family Households with Children
COMPARE
Tohono O'odham
Greek
Family Households with Children
Family Households with Children Comparison
Tohono O'odham
Greeks
28.0%
FAMILY HOUSEHOLDS WITH CHILDREN
97.6/ 100
METRIC RATING
109th/ 347
METRIC RANK
27.1%
FAMILY HOUSEHOLDS WITH CHILDREN
11.4/ 100
METRIC RATING
218th/ 347
METRIC RANK
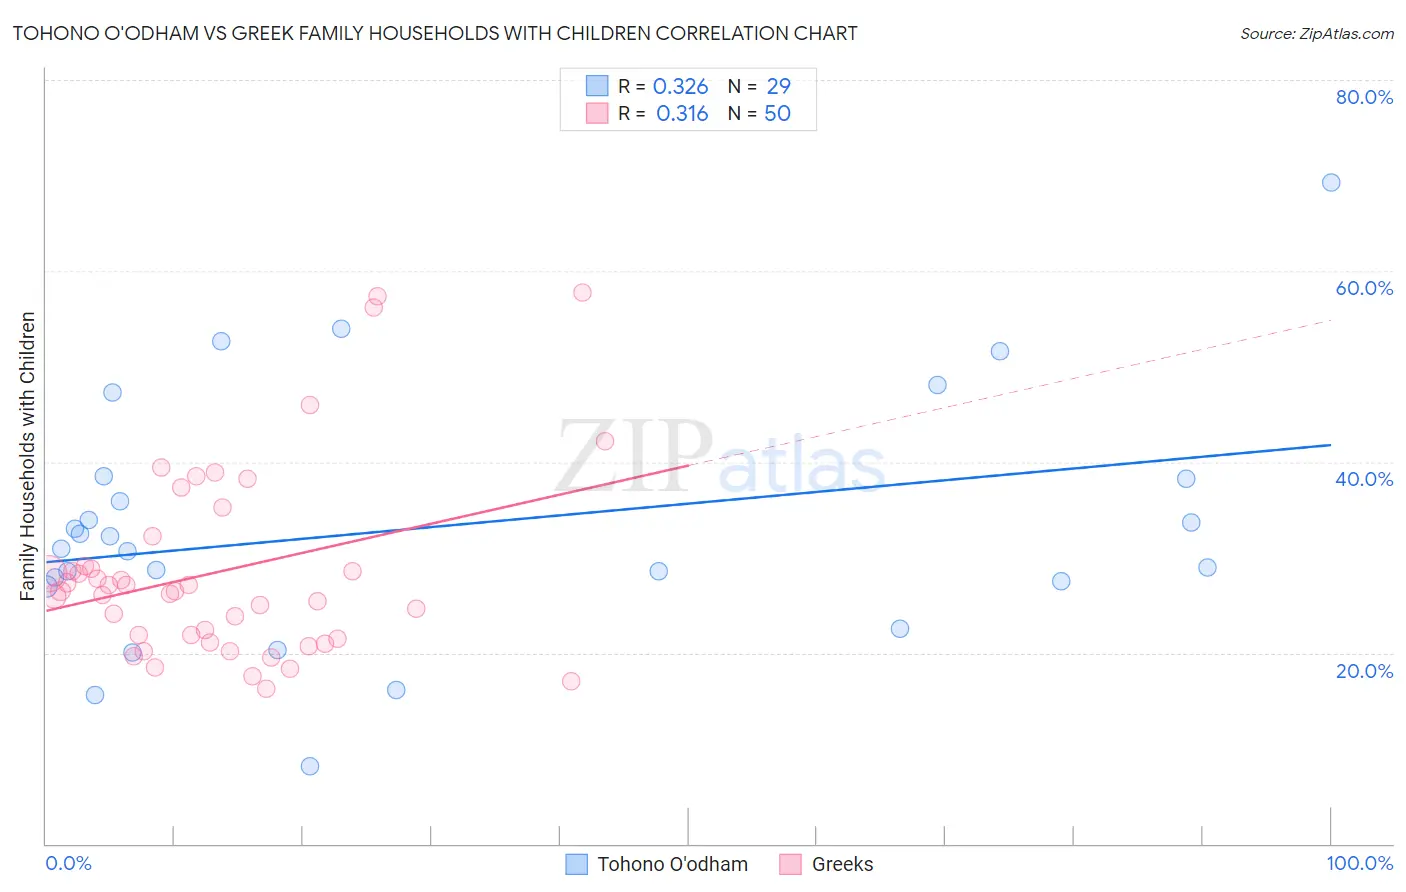
Tohono O'odham vs Greek Family Households with Children Correlation Chart
The statistical analysis conducted on geographies consisting of 58,703,775 people shows a mild positive correlation between the proportion of Tohono O'odham and percentage of family households with children in the United States with a correlation coefficient (R) of 0.326 and weighted average of 28.0%. Similarly, the statistical analysis conducted on geographies consisting of 482,098,294 people shows a mild positive correlation between the proportion of Greeks and percentage of family households with children in the United States with a correlation coefficient (R) of 0.316 and weighted average of 27.1%, a difference of 3.2%.
Family Households with Children Correlation Summary
| Measurement | Tohono O'odham | Greek |
| Minimum | 8.1% | 16.2% |
| Maximum | 69.3% | 57.7% |
| Range | 61.2% | 41.5% |
| Mean | 33.2% | 28.5% |
| Median | 30.8% | 26.5% |
| Interquartile 25% (IQ1) | 27.2% | 21.5% |
| Interquartile 75% (IQ3) | 38.3% | 29.1% |
| Interquartile Range (IQR) | 11.1% | 7.6% |
| Standard Deviation (Sample) | 13.1% | 10.0% |
| Standard Deviation (Population) | 12.9% | 9.9% |
Similar Demographics by Family Households with Children
Demographics Similar to Tohono O'odham by Family Households with Children
In terms of family households with children, the demographic groups most similar to Tohono O'odham are Immigrants from Burma/Myanmar (28.0%, a difference of 0.010%), Immigrants from Uganda (28.0%, a difference of 0.020%), Spaniard (28.0%, a difference of 0.040%), Immigrants from South America (28.0%, a difference of 0.090%), and Scandinavian (28.0%, a difference of 0.10%).
| Demographics | Rating | Rank | Family Households with Children |
| Assyrians/Chaldeans/Syriacs | 98.7 /100 | #102 | Exceptional 28.1% |
| Palestinians | 98.5 /100 | #103 | Exceptional 28.1% |
| Sioux | 98.3 /100 | #104 | Exceptional 28.1% |
| Choctaw | 98.3 /100 | #105 | Exceptional 28.1% |
| Immigrants | South America | 98.0 /100 | #106 | Exceptional 28.0% |
| Immigrants | Uganda | 97.7 /100 | #107 | Exceptional 28.0% |
| Immigrants | Burma/Myanmar | 97.7 /100 | #108 | Exceptional 28.0% |
| Tohono O'odham | 97.6 /100 | #109 | Exceptional 28.0% |
| Spaniards | 97.4 /100 | #110 | Exceptional 28.0% |
| Scandinavians | 97.1 /100 | #111 | Exceptional 28.0% |
| Immigrants | Middle Africa | 97.0 /100 | #112 | Exceptional 28.0% |
| Arabs | 97.0 /100 | #113 | Exceptional 28.0% |
| South American Indians | 96.9 /100 | #114 | Exceptional 28.0% |
| Immigrants | Africa | 96.8 /100 | #115 | Exceptional 28.0% |
| Pakistanis | 96.0 /100 | #116 | Exceptional 27.9% |
Demographics Similar to Greeks by Family Households with Children
In terms of family households with children, the demographic groups most similar to Greeks are Cuban (27.1%, a difference of 0.040%), U.S. Virgin Islander (27.1%, a difference of 0.040%), Immigrants from Japan (27.1%, a difference of 0.040%), African (27.2%, a difference of 0.080%), and Northern European (27.2%, a difference of 0.080%).
| Demographics | Rating | Rank | Family Households with Children |
| Welsh | 14.2 /100 | #211 | Poor 27.2% |
| Immigrants | Dominica | 13.9 /100 | #212 | Poor 27.2% |
| Okinawans | 13.7 /100 | #213 | Poor 27.2% |
| Africans | 13.0 /100 | #214 | Poor 27.2% |
| Northern Europeans | 12.8 /100 | #215 | Poor 27.2% |
| Cubans | 12.2 /100 | #216 | Poor 27.1% |
| U.S. Virgin Islanders | 12.1 /100 | #217 | Poor 27.1% |
| Greeks | 11.4 /100 | #218 | Poor 27.1% |
| Immigrants | Japan | 10.7 /100 | #219 | Poor 27.1% |
| Austrians | 9.9 /100 | #220 | Tragic 27.1% |
| New Zealanders | 9.6 /100 | #221 | Tragic 27.1% |
| Paraguayans | 9.4 /100 | #222 | Tragic 27.1% |
| Pima | 9.2 /100 | #223 | Tragic 27.1% |
| Germans | 8.7 /100 | #224 | Tragic 27.1% |
| Canadians | 7.5 /100 | #225 | Tragic 27.1% |