Taiwanese vs Immigrants from Belgium Family Households with Children
COMPARE
Taiwanese
Immigrants from Belgium
Family Households with Children
Family Households with Children Comparison
Taiwanese
Immigrants from Belgium
26.7%
FAMILY HOUSEHOLDS WITH CHILDREN
0.9/ 100
METRIC RATING
264th/ 347
METRIC RANK
26.7%
FAMILY HOUSEHOLDS WITH CHILDREN
0.9/ 100
METRIC RATING
268th/ 347
METRIC RANK
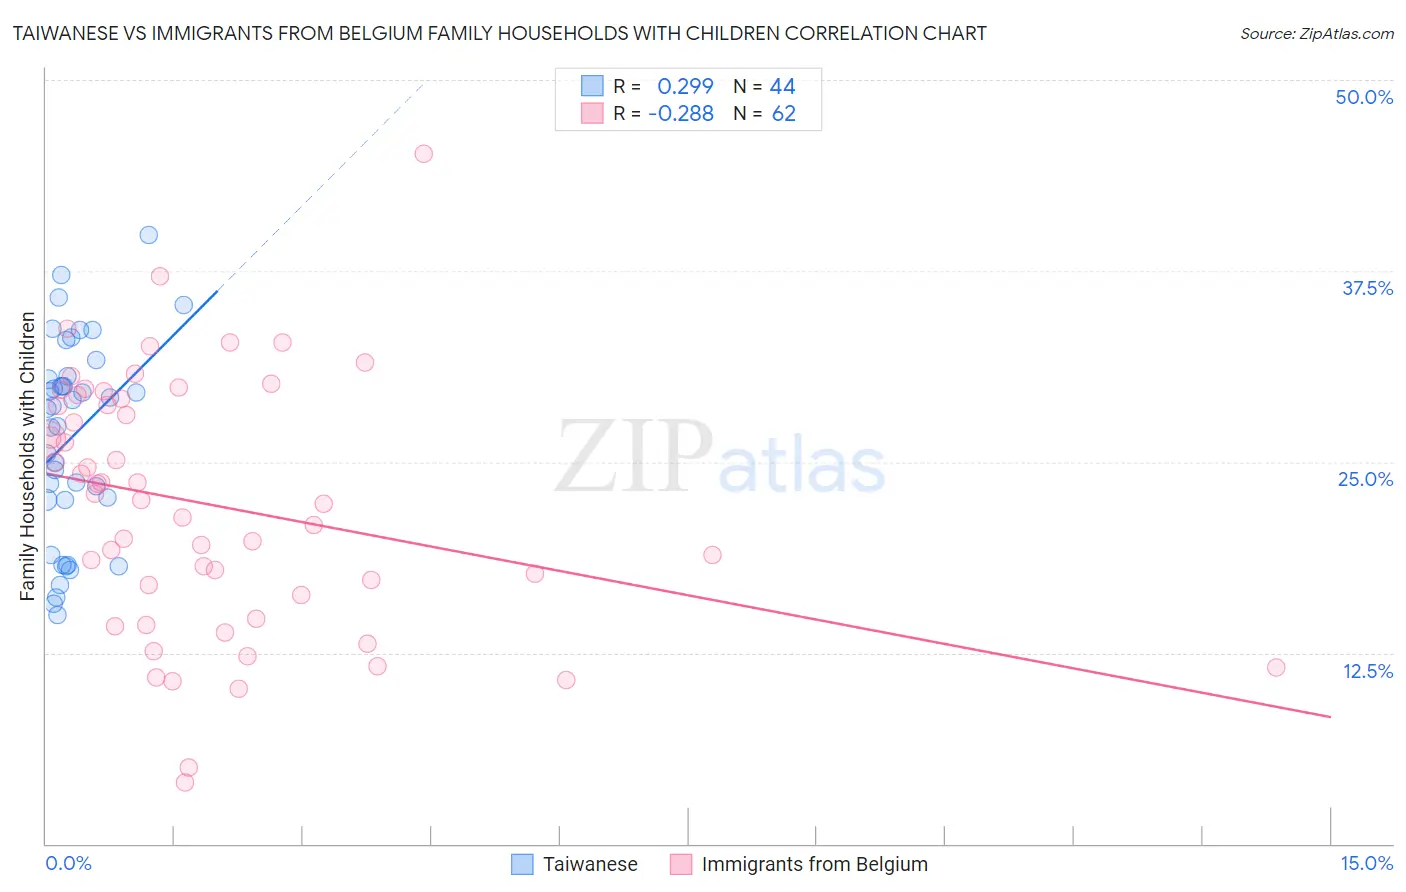
Taiwanese vs Immigrants from Belgium Family Households with Children Correlation Chart
The statistical analysis conducted on geographies consisting of 31,709,765 people shows a weak positive correlation between the proportion of Taiwanese and percentage of family households with children in the United States with a correlation coefficient (R) of 0.299 and weighted average of 26.7%. Similarly, the statistical analysis conducted on geographies consisting of 146,676,152 people shows a weak negative correlation between the proportion of Immigrants from Belgium and percentage of family households with children in the United States with a correlation coefficient (R) of -0.288 and weighted average of 26.7%, a difference of 0.020%.
Family Households with Children Correlation Summary
| Measurement | Taiwanese | Immigrants from Belgium |
| Minimum | 15.0% | 4.0% |
| Maximum | 39.9% | 45.1% |
| Range | 24.9% | 41.1% |
| Mean | 26.7% | 22.2% |
| Median | 28.5% | 22.7% |
| Interquartile 25% (IQ1) | 22.5% | 16.3% |
| Interquartile 75% (IQ3) | 30.5% | 29.1% |
| Interquartile Range (IQR) | 8.0% | 12.8% |
| Standard Deviation (Sample) | 6.4% | 8.3% |
| Standard Deviation (Population) | 6.4% | 8.2% |
Demographics Similar to Taiwanese and Immigrants from Belgium by Family Households with Children
In terms of family households with children, the demographic groups most similar to Taiwanese are Chippewa (26.7%, a difference of 0.010%), Maltese (26.7%, a difference of 0.010%), Immigrants from Uzbekistan (26.7%, a difference of 0.010%), Immigrants from North Macedonia (26.7%, a difference of 0.030%), and Immigrants from Russia (26.8%, a difference of 0.040%). Similarly, the demographic groups most similar to Immigrants from Belgium are Maltese (26.7%, a difference of 0.010%), Immigrants from Uzbekistan (26.7%, a difference of 0.010%), Chippewa (26.7%, a difference of 0.020%), Immigrants from Denmark (26.7%, a difference of 0.040%), and Immigrants from Russia (26.8%, a difference of 0.060%).
| Demographics | Rating | Rank | Family Households with Children |
| Scotch-Irish | 1.4 /100 | #256 | Tragic 26.8% |
| Slavs | 1.3 /100 | #257 | Tragic 26.8% |
| Immigrants | Cuba | 1.3 /100 | #258 | Tragic 26.8% |
| Immigrants | Lithuania | 1.2 /100 | #259 | Tragic 26.8% |
| Immigrants | Jamaica | 1.2 /100 | #260 | Tragic 26.8% |
| Immigrants | Belarus | 1.1 /100 | #261 | Tragic 26.8% |
| Immigrants | Russia | 1.0 /100 | #262 | Tragic 26.8% |
| Immigrants | North Macedonia | 1.0 /100 | #263 | Tragic 26.7% |
| Taiwanese | 0.9 /100 | #264 | Tragic 26.7% |
| Chippewa | 0.9 /100 | #265 | Tragic 26.7% |
| Maltese | 0.9 /100 | #266 | Tragic 26.7% |
| Immigrants | Uzbekistan | 0.9 /100 | #267 | Tragic 26.7% |
| Immigrants | Belgium | 0.9 /100 | #268 | Tragic 26.7% |
| Immigrants | Denmark | 0.8 /100 | #269 | Tragic 26.7% |
| Immigrants | Zaire | 0.7 /100 | #270 | Tragic 26.7% |
| French | 0.7 /100 | #271 | Tragic 26.7% |
| Somalis | 0.7 /100 | #272 | Tragic 26.7% |
| Immigrants | Hungary | 0.6 /100 | #273 | Tragic 26.7% |
| Eastern Europeans | 0.6 /100 | #274 | Tragic 26.7% |
| Immigrants | Northern Europe | 0.5 /100 | #275 | Tragic 26.7% |
| Immigrants | Spain | 0.5 /100 | #276 | Tragic 26.6% |