Syrian vs Iraqi Single Mother Households
COMPARE
Syrian
Iraqi
Single Mother Households
Single Mother Households Comparison
Syrians
Iraqis
6.0%
SINGLE MOTHER HOUSEHOLDS
86.0/ 100
METRIC RATING
139th/ 347
METRIC RANK
6.1%
SINGLE MOTHER HOUSEHOLDS
73.0/ 100
METRIC RATING
160th/ 347
METRIC RANK
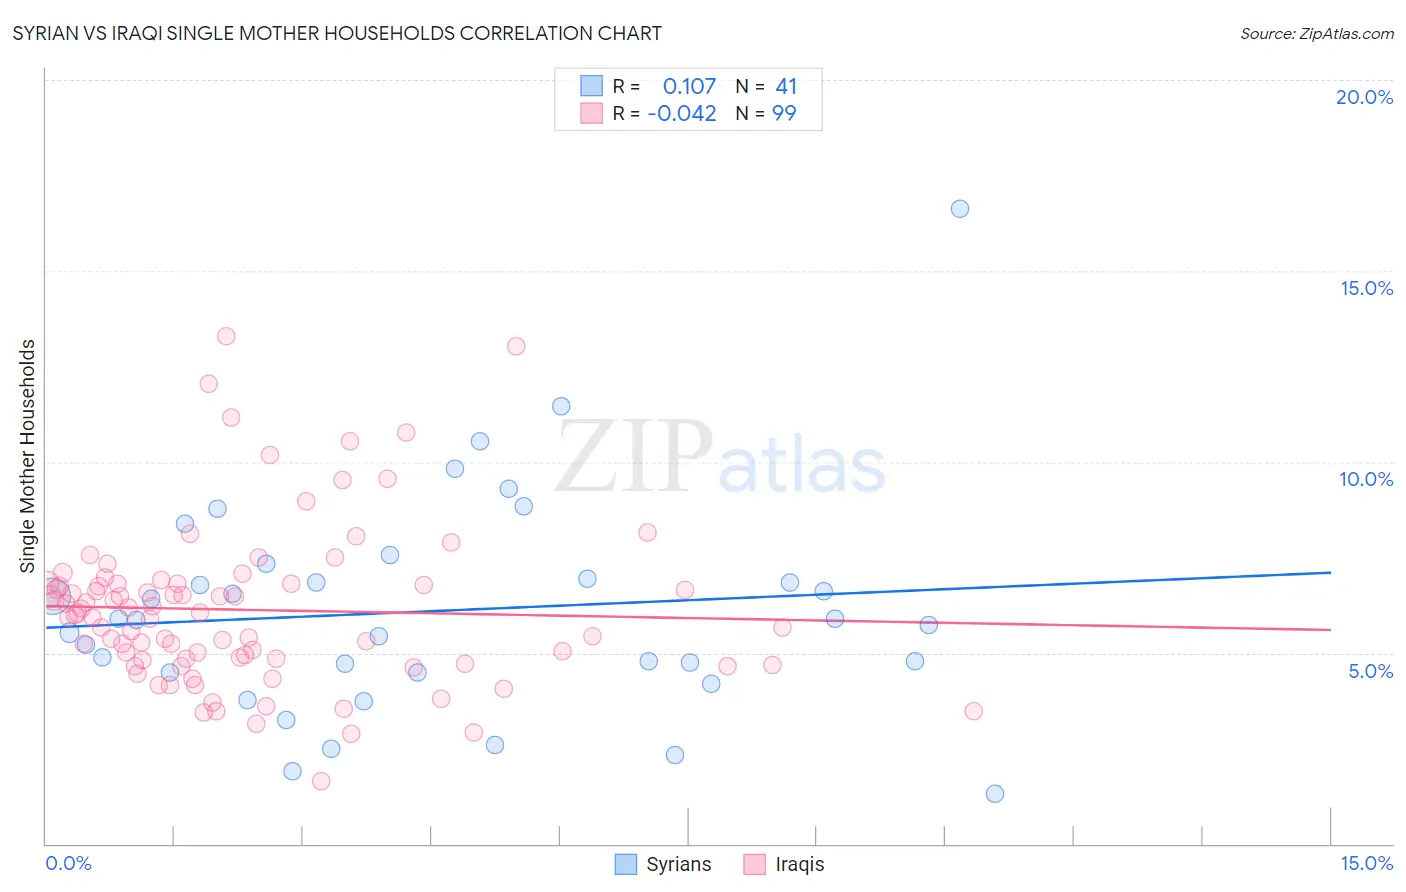
Syrian vs Iraqi Single Mother Households Correlation Chart
The statistical analysis conducted on geographies consisting of 265,755,115 people shows a poor positive correlation between the proportion of Syrians and percentage of single mother households in the United States with a correlation coefficient (R) of 0.107 and weighted average of 6.0%. Similarly, the statistical analysis conducted on geographies consisting of 170,443,045 people shows no correlation between the proportion of Iraqis and percentage of single mother households in the United States with a correlation coefficient (R) of -0.042 and weighted average of 6.1%, a difference of 2.4%.
Single Mother Households Correlation Summary
| Measurement | Syrian | Iraqi |
| Minimum | 1.3% | 1.6% |
| Maximum | 16.6% | 13.3% |
| Range | 15.3% | 11.7% |
| Mean | 6.1% | 6.1% |
| Median | 5.8% | 6.0% |
| Interquartile 25% (IQ1) | 4.5% | 4.8% |
| Interquartile 75% (IQ3) | 7.1% | 6.8% |
| Interquartile Range (IQR) | 2.7% | 2.0% |
| Standard Deviation (Sample) | 2.9% | 2.1% |
| Standard Deviation (Population) | 2.8% | 2.1% |
Similar Demographics by Single Mother Households
Demographics Similar to Syrians by Single Mother Households
In terms of single mother households, the demographic groups most similar to Syrians are French (6.0%, a difference of 0.070%), Tsimshian (6.0%, a difference of 0.17%), Immigrants from Egypt (6.0%, a difference of 0.22%), Icelander (6.0%, a difference of 0.23%), and Immigrants from Iraq (6.0%, a difference of 0.26%).
| Demographics | Rating | Rank | Single Mother Households |
| Albanians | 91.1 /100 | #132 | Exceptional 5.9% |
| Egyptians | 90.7 /100 | #133 | Exceptional 5.9% |
| Canadians | 90.5 /100 | #134 | Exceptional 5.9% |
| Immigrants | Saudi Arabia | 90.2 /100 | #135 | Exceptional 5.9% |
| Jordanians | 88.9 /100 | #136 | Excellent 6.0% |
| Immigrants | Pakistan | 88.4 /100 | #137 | Excellent 6.0% |
| Icelanders | 86.9 /100 | #138 | Excellent 6.0% |
| Syrians | 86.0 /100 | #139 | Excellent 6.0% |
| French | 85.7 /100 | #140 | Excellent 6.0% |
| Tsimshian | 85.2 /100 | #141 | Excellent 6.0% |
| Immigrants | Egypt | 85.0 /100 | #142 | Excellent 6.0% |
| Immigrants | Iraq | 84.8 /100 | #143 | Excellent 6.0% |
| Koreans | 84.4 /100 | #144 | Excellent 6.0% |
| Arabs | 84.0 /100 | #145 | Excellent 6.0% |
| French Canadians | 82.6 /100 | #146 | Excellent 6.0% |
Demographics Similar to Iraqis by Single Mother Households
In terms of single mother households, the demographic groups most similar to Iraqis are Yugoslavian (6.1%, a difference of 0.010%), Celtic (6.1%, a difference of 0.050%), Immigrants from Germany (6.1%, a difference of 0.080%), Chilean (6.1%, a difference of 0.19%), and Native Hawaiian (6.1%, a difference of 0.29%).
| Demographics | Rating | Rank | Single Mother Households |
| Immigrants | Brazil | 78.9 /100 | #153 | Good 6.1% |
| Immigrants | Philippines | 78.5 /100 | #154 | Good 6.1% |
| Whites/Caucasians | 76.5 /100 | #155 | Good 6.1% |
| Native Hawaiians | 75.0 /100 | #156 | Good 6.1% |
| Chileans | 74.2 /100 | #157 | Good 6.1% |
| Celtics | 73.3 /100 | #158 | Good 6.1% |
| Yugoslavians | 73.1 /100 | #159 | Good 6.1% |
| Iraqis | 73.0 /100 | #160 | Good 6.1% |
| Immigrants | Germany | 72.4 /100 | #161 | Good 6.1% |
| Immigrants | Zimbabwe | 69.9 /100 | #162 | Good 6.2% |
| Alsatians | 68.7 /100 | #163 | Good 6.2% |
| Immigrants | Northern Africa | 68.0 /100 | #164 | Good 6.2% |
| Immigrants | Syria | 67.4 /100 | #165 | Good 6.2% |
| Sri Lankans | 63.9 /100 | #166 | Good 6.2% |
| Brazilians | 59.1 /100 | #167 | Average 6.2% |