Nepalese vs Immigrants from Bolivia Family Households with Children
COMPARE
Nepalese
Immigrants from Bolivia
Family Households with Children
Family Households with Children Comparison
Nepalese
Immigrants from Bolivia
30.5%
FAMILY HOUSEHOLDS WITH CHILDREN
100.0/ 100
METRIC RATING
11th/ 347
METRIC RANK
29.3%
FAMILY HOUSEHOLDS WITH CHILDREN
100.0/ 100
METRIC RATING
34th/ 347
METRIC RANK
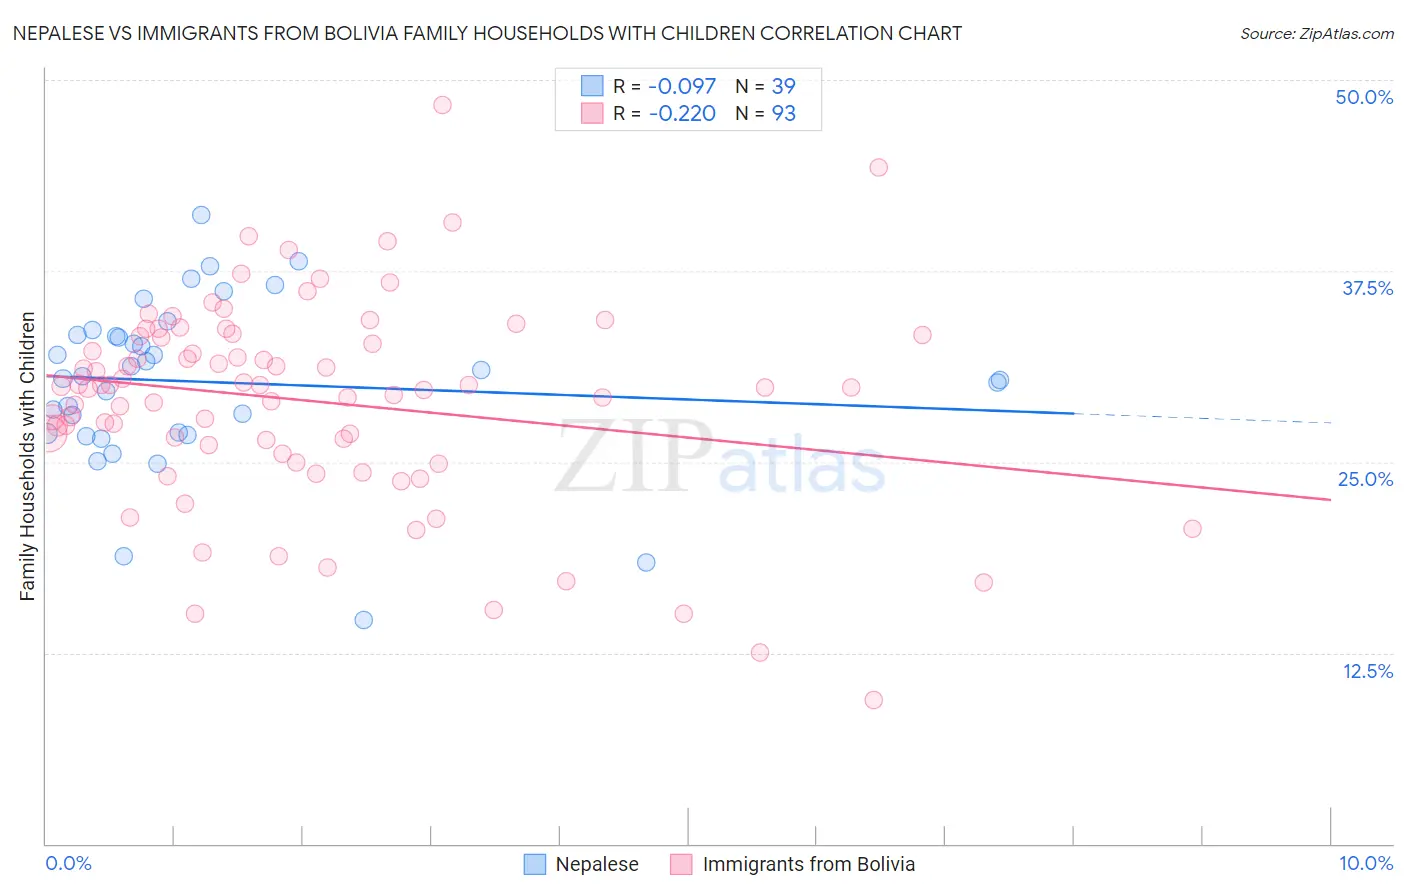
Nepalese vs Immigrants from Bolivia Family Households with Children Correlation Chart
The statistical analysis conducted on geographies consisting of 24,519,269 people shows a slight negative correlation between the proportion of Nepalese and percentage of family households with children in the United States with a correlation coefficient (R) of -0.097 and weighted average of 30.5%. Similarly, the statistical analysis conducted on geographies consisting of 158,666,427 people shows a weak negative correlation between the proportion of Immigrants from Bolivia and percentage of family households with children in the United States with a correlation coefficient (R) of -0.220 and weighted average of 29.3%, a difference of 4.0%.
Family Households with Children Correlation Summary
| Measurement | Nepalese | Immigrants from Bolivia |
| Minimum | 14.7% | 9.4% |
| Maximum | 41.2% | 48.4% |
| Range | 26.5% | 39.0% |
| Mean | 30.2% | 29.0% |
| Median | 30.6% | 29.9% |
| Interquartile 25% (IQ1) | 26.8% | 25.8% |
| Interquartile 75% (IQ3) | 33.3% | 33.3% |
| Interquartile Range (IQR) | 6.5% | 7.4% |
| Standard Deviation (Sample) | 5.5% | 6.7% |
| Standard Deviation (Population) | 5.4% | 6.7% |
Similar Demographics by Family Households with Children
Demographics Similar to Nepalese by Family Households with Children
In terms of family households with children, the demographic groups most similar to Nepalese are Immigrants from Fiji (30.5%, a difference of 0.080%), Thai (30.6%, a difference of 0.40%), Yakama (30.8%, a difference of 0.88%), Immigrants from Pakistan (30.2%, a difference of 0.88%), and Afghan (30.2%, a difference of 1.1%).
| Demographics | Rating | Rank | Family Households with Children |
| Mexicans | 100.0 /100 | #4 | Exceptional 31.4% |
| Tongans | 100.0 /100 | #5 | Exceptional 31.2% |
| Immigrants | India | 100.0 /100 | #6 | Exceptional 31.0% |
| Immigrants | Central America | 100.0 /100 | #7 | Exceptional 31.0% |
| Yakama | 100.0 /100 | #8 | Exceptional 30.8% |
| Thais | 100.0 /100 | #9 | Exceptional 30.6% |
| Immigrants | Fiji | 100.0 /100 | #10 | Exceptional 30.5% |
| Nepalese | 100.0 /100 | #11 | Exceptional 30.5% |
| Immigrants | Pakistan | 100.0 /100 | #12 | Exceptional 30.2% |
| Afghans | 100.0 /100 | #13 | Exceptional 30.2% |
| Bangladeshis | 100.0 /100 | #14 | Exceptional 30.1% |
| Immigrants | South Central Asia | 100.0 /100 | #15 | Exceptional 30.0% |
| Immigrants | Afghanistan | 100.0 /100 | #16 | Exceptional 30.0% |
| Hispanics or Latinos | 100.0 /100 | #17 | Exceptional 29.9% |
| Salvadorans | 100.0 /100 | #18 | Exceptional 29.9% |
Demographics Similar to Immigrants from Bolivia by Family Households with Children
In terms of family households with children, the demographic groups most similar to Immigrants from Bolivia are Venezuelan (29.4%, a difference of 0.060%), Immigrants from Sierra Leone (29.3%, a difference of 0.16%), Immigrants from Venezuela (29.3%, a difference of 0.17%), Immigrants from Yemen (29.4%, a difference of 0.25%), and Japanese (29.4%, a difference of 0.31%).
| Demographics | Rating | Rank | Family Households with Children |
| Immigrants | Vietnam | 100.0 /100 | #27 | Exceptional 29.5% |
| Samoans | 100.0 /100 | #28 | Exceptional 29.5% |
| Bolivians | 100.0 /100 | #29 | Exceptional 29.5% |
| Yuman | 100.0 /100 | #30 | Exceptional 29.5% |
| Japanese | 100.0 /100 | #31 | Exceptional 29.4% |
| Immigrants | Yemen | 100.0 /100 | #32 | Exceptional 29.4% |
| Venezuelans | 100.0 /100 | #33 | Exceptional 29.4% |
| Immigrants | Bolivia | 100.0 /100 | #34 | Exceptional 29.3% |
| Immigrants | Sierra Leone | 100.0 /100 | #35 | Exceptional 29.3% |
| Immigrants | Venezuela | 100.0 /100 | #36 | Exceptional 29.3% |
| Immigrants | Cameroon | 100.0 /100 | #37 | Exceptional 29.2% |
| Koreans | 100.0 /100 | #38 | Exceptional 29.2% |
| Yaqui | 100.0 /100 | #39 | Exceptional 29.1% |
| Central Americans | 100.0 /100 | #40 | Exceptional 29.1% |
| Immigrants | South Eastern Asia | 100.0 /100 | #41 | Exceptional 29.1% |