Blackfeet vs Trinidadian and Tobagonian Average Family Size
COMPARE
Blackfeet
Trinidadian and Tobagonian
Average Family Size
Average Family Size Comparison
Blackfeet
Trinidadians and Tobagonians
3.24
AVERAGE FAMILY SIZE
75.0/ 100
METRIC RATING
148th/ 347
METRIC RANK
3.32
AVERAGE FAMILY SIZE
99.8/ 100
METRIC RATING
76th/ 347
METRIC RANK
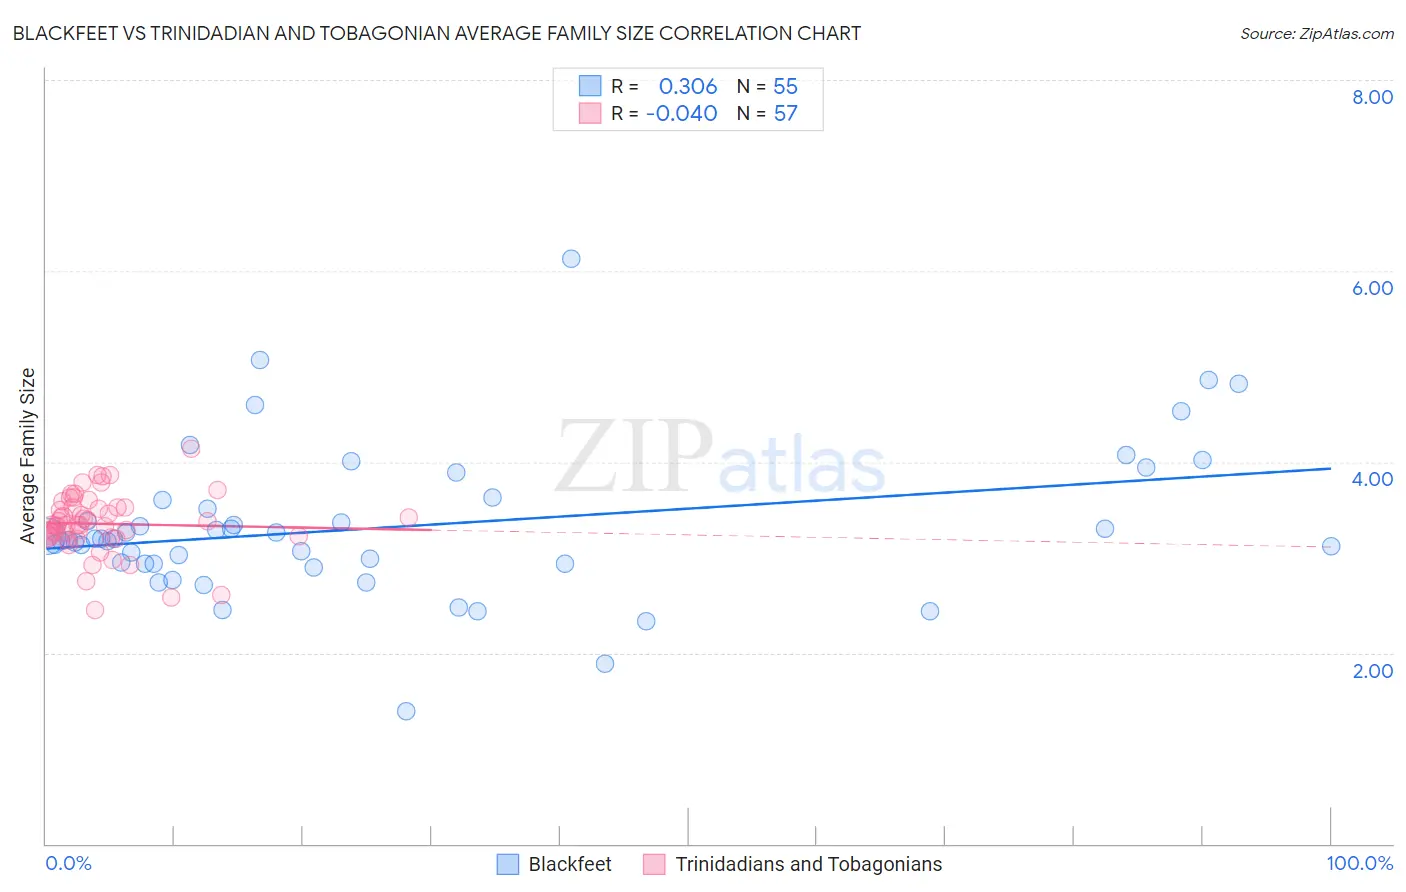
Blackfeet vs Trinidadian and Tobagonian Average Family Size Correlation Chart
The statistical analysis conducted on geographies consisting of 309,476,508 people shows a mild positive correlation between the proportion of Blackfeet and average family size in the United States with a correlation coefficient (R) of 0.306 and weighted average of 3.24. Similarly, the statistical analysis conducted on geographies consisting of 219,714,835 people shows no correlation between the proportion of Trinidadians and Tobagonians and average family size in the United States with a correlation coefficient (R) of -0.040 and weighted average of 3.32, a difference of 2.4%.
Average Family Size Correlation Summary
| Measurement | Blackfeet | Trinidadian and Tobagonian |
| Minimum | 1.39 | 2.45 |
| Maximum | 6.13 | 4.14 |
| Range | 4.74 | 1.69 |
| Mean | 3.32 | 3.35 |
| Median | 3.19 | 3.34 |
| Interquartile 25% (IQ1) | 2.93 | 3.22 |
| Interquartile 75% (IQ3) | 3.60 | 3.52 |
| Interquartile Range (IQR) | 0.67 | 0.31 |
| Standard Deviation (Sample) | 0.80 | 0.32 |
| Standard Deviation (Population) | 0.79 | 0.32 |
Similar Demographics by Average Family Size
Demographics Similar to Blackfeet by Average Family Size
In terms of average family size, the demographic groups most similar to Blackfeet are Immigrants from Jordan (3.24, a difference of 0.020%), Assyrian/Chaldean/Syriac (3.24, a difference of 0.030%), Indian (Asian) (3.24, a difference of 0.030%), Jordanian (3.24, a difference of 0.040%), and Spanish American (3.24, a difference of 0.060%).
| Demographics | Rating | Rank | Average Family Size |
| Venezuelans | 81.4 /100 | #141 | Excellent 3.25 |
| Liberians | 81.2 /100 | #142 | Excellent 3.25 |
| Bhutanese | 81.0 /100 | #143 | Excellent 3.25 |
| Tsimshian | 80.2 /100 | #144 | Excellent 3.25 |
| Armenians | 78.2 /100 | #145 | Good 3.25 |
| Immigrants | Africa | 77.9 /100 | #146 | Good 3.25 |
| Immigrants | Jordan | 75.7 /100 | #147 | Good 3.24 |
| Blackfeet | 75.0 /100 | #148 | Good 3.24 |
| Assyrians/Chaldeans/Syriacs | 73.8 /100 | #149 | Good 3.24 |
| Indians (Asian) | 73.6 /100 | #150 | Good 3.24 |
| Jordanians | 73.5 /100 | #151 | Good 3.24 |
| Spanish Americans | 72.5 /100 | #152 | Good 3.24 |
| Immigrants | Eritrea | 71.4 /100 | #153 | Good 3.24 |
| Immigrants | Egypt | 70.0 /100 | #154 | Good 3.24 |
| Seminole | 68.2 /100 | #155 | Good 3.24 |
Demographics Similar to Trinidadians and Tobagonians by Average Family Size
In terms of average family size, the demographic groups most similar to Trinidadians and Tobagonians are Immigrants from Ecuador (3.32, a difference of 0.010%), Immigrants from Barbados (3.32, a difference of 0.020%), Immigrants from Sierra Leone (3.32, a difference of 0.050%), Immigrants from Micronesia (3.32, a difference of 0.050%), and British West Indian (3.32, a difference of 0.060%).
| Demographics | Rating | Rank | Average Family Size |
| Immigrants | Immigrants | 99.9 /100 | #69 | Exceptional 3.33 |
| Immigrants | Trinidad and Tobago | 99.9 /100 | #70 | Exceptional 3.33 |
| Immigrants | West Indies | 99.9 /100 | #71 | Exceptional 3.33 |
| Immigrants | Caribbean | 99.9 /100 | #72 | Exceptional 3.33 |
| Yaqui | 99.9 /100 | #73 | Exceptional 3.32 |
| Immigrants | Sierra Leone | 99.9 /100 | #74 | Exceptional 3.32 |
| Immigrants | Barbados | 99.8 /100 | #75 | Exceptional 3.32 |
| Trinidadians and Tobagonians | 99.8 /100 | #76 | Exceptional 3.32 |
| Immigrants | Ecuador | 99.8 /100 | #77 | Exceptional 3.32 |
| Immigrants | Micronesia | 99.8 /100 | #78 | Exceptional 3.32 |
| British West Indians | 99.8 /100 | #79 | Exceptional 3.32 |
| Lumbee | 99.8 /100 | #80 | Exceptional 3.32 |
| Immigrants | Dominica | 99.8 /100 | #81 | Exceptional 3.32 |
| Ecuadorians | 99.8 /100 | #82 | Exceptional 3.32 |
| Immigrants | Afghanistan | 99.8 /100 | #83 | Exceptional 3.32 |