Sudanese vs Sioux Unemployment Among Ages 35 to 44 years
COMPARE
Sudanese
Sioux
Unemployment Among Ages 35 to 44 years
Unemployment Among Ages 35 to 44 years Comparison
Sudanese
Sioux
4.1%
UNEMPLOYMENT AMONG AGES 35 TO 44 YEARS
99.9/ 100
METRIC RATING
11th/ 347
METRIC RANK
8.4%
UNEMPLOYMENT AMONG AGES 35 TO 44 YEARS
0.0/ 100
METRIC RATING
335th/ 347
METRIC RANK
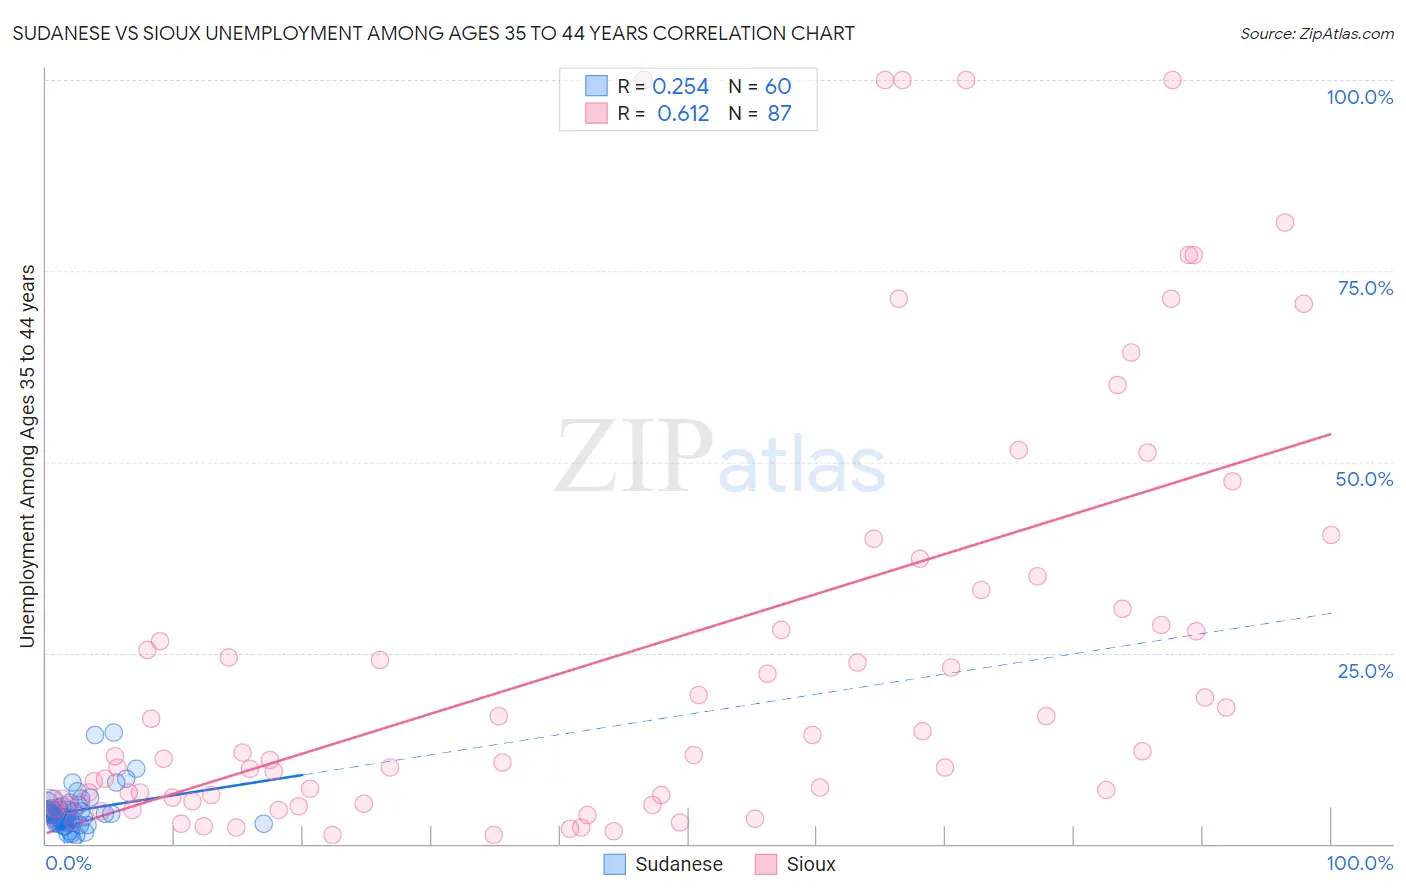
Sudanese vs Sioux Unemployment Among Ages 35 to 44 years Correlation Chart
The statistical analysis conducted on geographies consisting of 109,577,275 people shows a weak positive correlation between the proportion of Sudanese and unemployment rate among population between the ages 35 and 44 in the United States with a correlation coefficient (R) of 0.254 and weighted average of 4.1%. Similarly, the statistical analysis conducted on geographies consisting of 229,285,437 people shows a significant positive correlation between the proportion of Sioux and unemployment rate among population between the ages 35 and 44 in the United States with a correlation coefficient (R) of 0.612 and weighted average of 8.4%, a difference of 102.7%.
Unemployment Among Ages 35 to 44 years Correlation Summary
| Measurement | Sudanese | Sioux |
| Minimum | 0.50% | 1.1% |
| Maximum | 14.5% | 100.0% |
| Range | 14.0% | 98.9% |
| Mean | 4.3% | 24.4% |
| Median | 3.9% | 11.4% |
| Interquartile 25% (IQ1) | 2.9% | 5.3% |
| Interquartile 75% (IQ3) | 4.7% | 30.8% |
| Interquartile Range (IQR) | 1.8% | 25.5% |
| Standard Deviation (Sample) | 2.6% | 27.7% |
| Standard Deviation (Population) | 2.6% | 27.6% |
Similar Demographics by Unemployment Among Ages 35 to 44 years
Demographics Similar to Sudanese by Unemployment Among Ages 35 to 44 years
In terms of unemployment among ages 35 to 44 years, the demographic groups most similar to Sudanese are Immigrants from Singapore (4.1%, a difference of 0.070%), Venezuelan (4.1%, a difference of 0.10%), Bolivian (4.1%, a difference of 0.14%), Czech (4.1%, a difference of 0.24%), and Tongan (4.2%, a difference of 0.33%).
| Demographics | Rating | Rank | Unemployment Among Ages 35 to 44 years |
| Immigrants | Taiwan | 100.0 /100 | #4 | Exceptional 4.0% |
| Filipinos | 100.0 /100 | #5 | Exceptional 4.0% |
| Immigrants | Venezuela | 100.0 /100 | #6 | Exceptional 4.0% |
| Immigrants | Cuba | 99.9 /100 | #7 | Exceptional 4.1% |
| Immigrants | South Central Asia | 99.9 /100 | #8 | Exceptional 4.1% |
| Danes | 99.9 /100 | #9 | Exceptional 4.1% |
| Immigrants | Singapore | 99.9 /100 | #10 | Exceptional 4.1% |
| Sudanese | 99.9 /100 | #11 | Exceptional 4.1% |
| Venezuelans | 99.9 /100 | #12 | Exceptional 4.1% |
| Bolivians | 99.9 /100 | #13 | Exceptional 4.1% |
| Czechs | 99.9 /100 | #14 | Exceptional 4.1% |
| Tongans | 99.8 /100 | #15 | Exceptional 4.2% |
| Cubans | 99.8 /100 | #16 | Exceptional 4.2% |
| Swedes | 99.8 /100 | #17 | Exceptional 4.2% |
| Latvians | 99.8 /100 | #18 | Exceptional 4.2% |
Demographics Similar to Sioux by Unemployment Among Ages 35 to 44 years
In terms of unemployment among ages 35 to 44 years, the demographic groups most similar to Sioux are Apache (8.4%, a difference of 0.29%), Tohono O'odham (8.4%, a difference of 0.65%), Cheyenne (8.5%, a difference of 1.2%), Inupiat (8.6%, a difference of 2.3%), and Alaskan Athabascan (8.6%, a difference of 3.0%).
| Demographics | Rating | Rank | Unemployment Among Ages 35 to 44 years |
| Shoshone | 0.0 /100 | #328 | Tragic 6.6% |
| Paiute | 0.0 /100 | #329 | Tragic 6.9% |
| Immigrants | Cabo Verde | 0.0 /100 | #330 | Tragic 6.9% |
| Pueblo | 0.0 /100 | #331 | Tragic 7.1% |
| Natives/Alaskans | 0.0 /100 | #332 | Tragic 7.3% |
| Puerto Ricans | 0.0 /100 | #333 | Tragic 7.6% |
| Houma | 0.0 /100 | #334 | Tragic 7.8% |
| Sioux | 0.0 /100 | #335 | Tragic 8.4% |
| Apache | 0.0 /100 | #336 | Tragic 8.4% |
| Tohono O'odham | 0.0 /100 | #337 | Tragic 8.4% |
| Cheyenne | 0.0 /100 | #338 | Tragic 8.5% |
| Inupiat | 0.0 /100 | #339 | Tragic 8.6% |
| Alaskan Athabascans | 0.0 /100 | #340 | Tragic 8.6% |
| Hopi | 0.0 /100 | #341 | Tragic 8.9% |
| Navajo | 0.0 /100 | #342 | Tragic 9.3% |