Sudanese vs Immigrants from Yemen Family Households with Children
COMPARE
Sudanese
Immigrants from Yemen
Family Households with Children
Family Households with Children Comparison
Sudanese
Immigrants from Yemen
27.4%
FAMILY HOUSEHOLDS WITH CHILDREN
37.6/ 100
METRIC RATING
191st/ 347
METRIC RANK
29.4%
FAMILY HOUSEHOLDS WITH CHILDREN
100.0/ 100
METRIC RATING
32nd/ 347
METRIC RANK
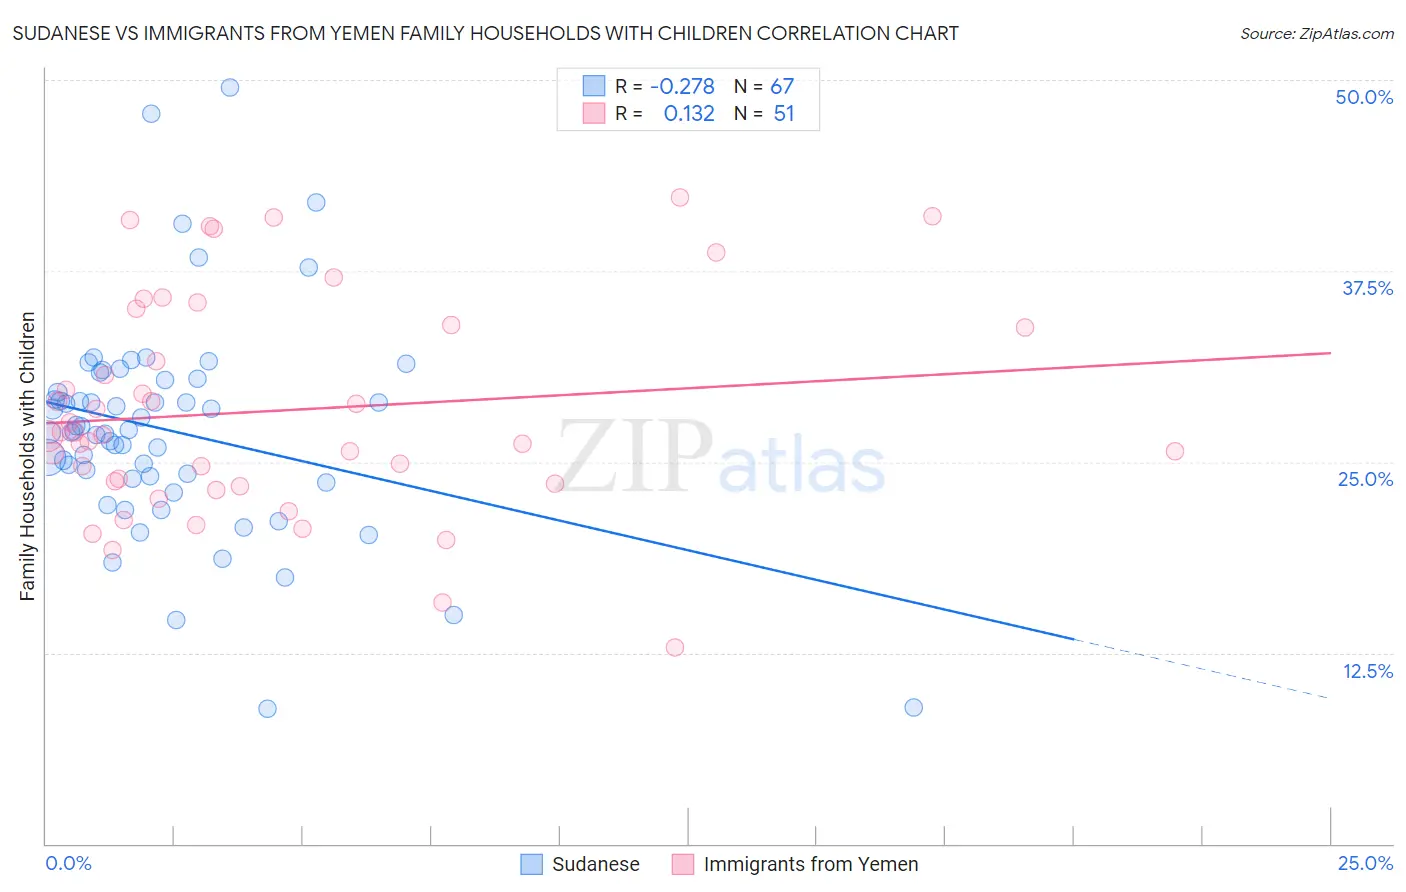
Sudanese vs Immigrants from Yemen Family Households with Children Correlation Chart
The statistical analysis conducted on geographies consisting of 110,102,819 people shows a weak negative correlation between the proportion of Sudanese and percentage of family households with children in the United States with a correlation coefficient (R) of -0.278 and weighted average of 27.4%. Similarly, the statistical analysis conducted on geographies consisting of 82,433,611 people shows a poor positive correlation between the proportion of Immigrants from Yemen and percentage of family households with children in the United States with a correlation coefficient (R) of 0.132 and weighted average of 29.4%, a difference of 7.5%.
Family Households with Children Correlation Summary
| Measurement | Sudanese | Immigrants from Yemen |
| Minimum | 8.8% | 12.8% |
| Maximum | 49.5% | 42.3% |
| Range | 40.7% | 29.4% |
| Mean | 27.1% | 28.4% |
| Median | 27.0% | 26.7% |
| Interquartile 25% (IQ1) | 23.9% | 23.6% |
| Interquartile 75% (IQ3) | 30.4% | 33.9% |
| Interquartile Range (IQR) | 6.4% | 10.4% |
| Standard Deviation (Sample) | 7.1% | 7.1% |
| Standard Deviation (Population) | 7.1% | 7.0% |
Similar Demographics by Family Households with Children
Demographics Similar to Sudanese by Family Households with Children
In terms of family households with children, the demographic groups most similar to Sudanese are Immigrants from Uruguay (27.4%, a difference of 0.0%), Pennsylvania German (27.4%, a difference of 0.0%), Immigrants from Israel (27.4%, a difference of 0.010%), Swedish (27.4%, a difference of 0.020%), and Dutch (27.4%, a difference of 0.030%).
| Demographics | Rating | Rank | Family Households with Children |
| Native Hawaiians | 44.6 /100 | #184 | Average 27.4% |
| Delaware | 42.0 /100 | #185 | Average 27.4% |
| Immigrants | Brazil | 40.6 /100 | #186 | Average 27.4% |
| Creek | 39.8 /100 | #187 | Fair 27.4% |
| Dutch | 38.8 /100 | #188 | Fair 27.4% |
| Immigrants | Israel | 37.9 /100 | #189 | Fair 27.4% |
| Immigrants | Uruguay | 37.7 /100 | #190 | Fair 27.4% |
| Sudanese | 37.6 /100 | #191 | Fair 27.4% |
| Pennsylvania Germans | 37.5 /100 | #192 | Fair 27.4% |
| Swedes | 36.9 /100 | #193 | Fair 27.4% |
| Immigrants | Iran | 36.1 /100 | #194 | Fair 27.4% |
| Crow | 35.7 /100 | #195 | Fair 27.4% |
| Cheyenne | 35.1 /100 | #196 | Fair 27.4% |
| Norwegians | 35.0 /100 | #197 | Fair 27.4% |
| Immigrants | Romania | 34.4 /100 | #198 | Fair 27.4% |
Demographics Similar to Immigrants from Yemen by Family Households with Children
In terms of family households with children, the demographic groups most similar to Immigrants from Yemen are Japanese (29.4%, a difference of 0.060%), Yuman (29.5%, a difference of 0.20%), Venezuelan (29.4%, a difference of 0.20%), Samoan (29.5%, a difference of 0.24%), and Bolivian (29.5%, a difference of 0.24%).
| Demographics | Rating | Rank | Family Households with Children |
| Immigrants | Latin America | 100.0 /100 | #25 | Exceptional 29.7% |
| Sri Lankans | 100.0 /100 | #26 | Exceptional 29.5% |
| Immigrants | Vietnam | 100.0 /100 | #27 | Exceptional 29.5% |
| Samoans | 100.0 /100 | #28 | Exceptional 29.5% |
| Bolivians | 100.0 /100 | #29 | Exceptional 29.5% |
| Yuman | 100.0 /100 | #30 | Exceptional 29.5% |
| Japanese | 100.0 /100 | #31 | Exceptional 29.4% |
| Immigrants | Yemen | 100.0 /100 | #32 | Exceptional 29.4% |
| Venezuelans | 100.0 /100 | #33 | Exceptional 29.4% |
| Immigrants | Bolivia | 100.0 /100 | #34 | Exceptional 29.3% |
| Immigrants | Sierra Leone | 100.0 /100 | #35 | Exceptional 29.3% |
| Immigrants | Venezuela | 100.0 /100 | #36 | Exceptional 29.3% |
| Immigrants | Cameroon | 100.0 /100 | #37 | Exceptional 29.2% |
| Koreans | 100.0 /100 | #38 | Exceptional 29.2% |
| Yaqui | 100.0 /100 | #39 | Exceptional 29.1% |