Sri Lankan vs Native Hawaiian Single Father Households
COMPARE
Sri Lankan
Native Hawaiian
Single Father Households
Single Father Households Comparison
Sri Lankans
Native Hawaiians
2.4%
SINGLE FATHER HOUSEHOLDS
41.8/ 100
METRIC RATING
184th/ 347
METRIC RANK
2.5%
SINGLE FATHER HOUSEHOLDS
2.5/ 100
METRIC RATING
246th/ 347
METRIC RANK
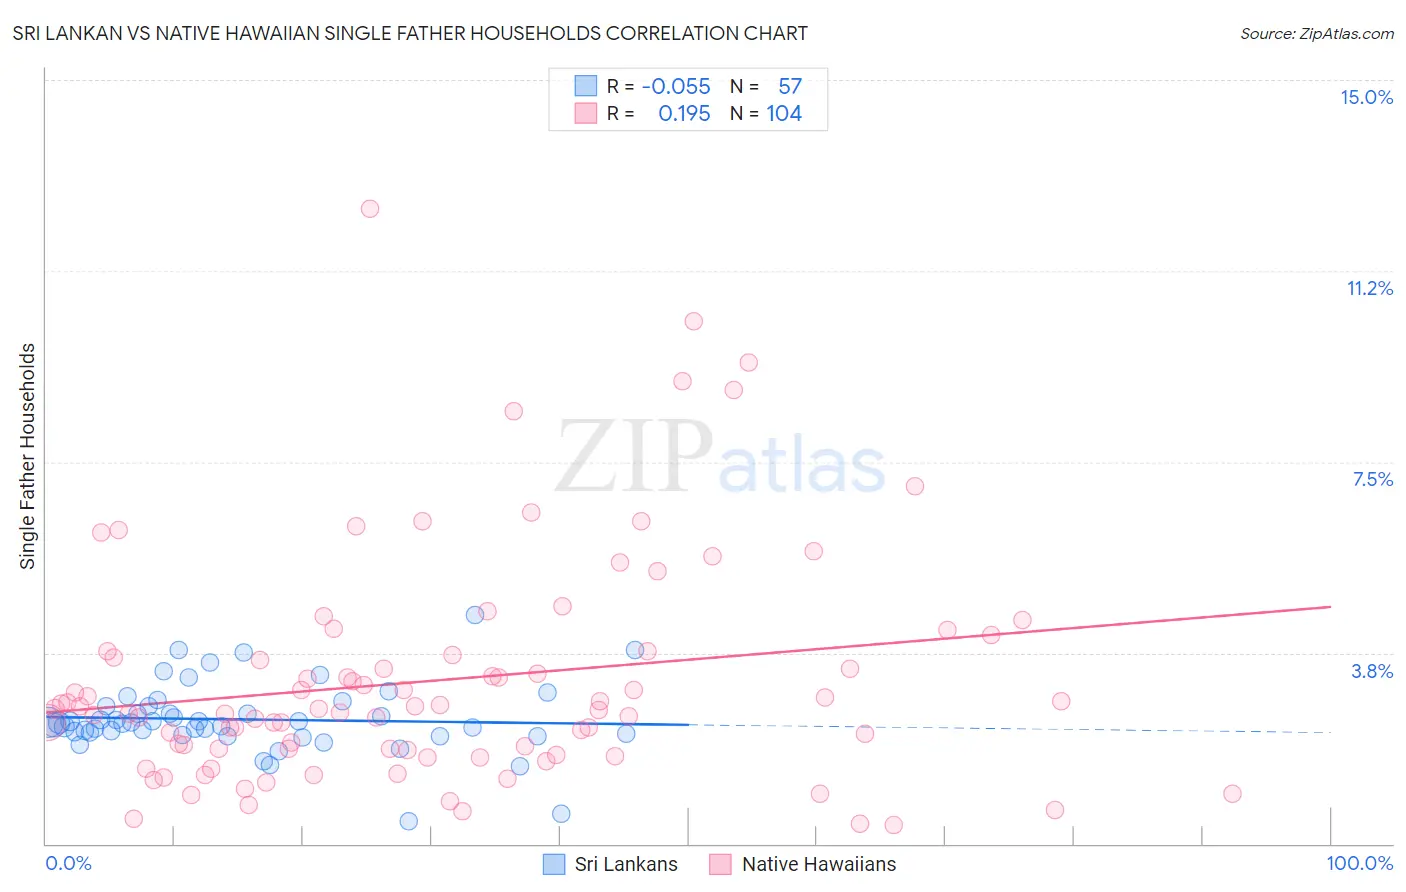
Sri Lankan vs Native Hawaiian Single Father Households Correlation Chart
The statistical analysis conducted on geographies consisting of 436,338,437 people shows a slight negative correlation between the proportion of Sri Lankans and percentage of single father households in the United States with a correlation coefficient (R) of -0.055 and weighted average of 2.4%. Similarly, the statistical analysis conducted on geographies consisting of 329,768,096 people shows a poor positive correlation between the proportion of Native Hawaiians and percentage of single father households in the United States with a correlation coefficient (R) of 0.195 and weighted average of 2.5%, a difference of 6.1%.
Single Father Households Correlation Summary
| Measurement | Sri Lankan | Native Hawaiian |
| Minimum | 0.45% | 0.37% |
| Maximum | 4.5% | 12.5% |
| Range | 4.0% | 12.1% |
| Mean | 2.4% | 3.2% |
| Median | 2.4% | 2.6% |
| Interquartile 25% (IQ1) | 2.1% | 1.8% |
| Interquartile 75% (IQ3) | 2.7% | 3.7% |
| Interquartile Range (IQR) | 0.56% | 1.9% |
| Standard Deviation (Sample) | 0.69% | 2.2% |
| Standard Deviation (Population) | 0.68% | 2.2% |
Similar Demographics by Single Father Households
Demographics Similar to Sri Lankans by Single Father Households
In terms of single father households, the demographic groups most similar to Sri Lankans are Immigrants from Panama (2.4%, a difference of 0.0%), Nigerian (2.4%, a difference of 0.060%), Immigrants from Bosnia and Herzegovina (2.4%, a difference of 0.10%), Belgian (2.3%, a difference of 0.11%), and Jamaican (2.3%, a difference of 0.13%).
| Demographics | Rating | Rank | Single Father Households |
| Colombians | 48.0 /100 | #177 | Average 2.3% |
| Costa Ricans | 44.1 /100 | #178 | Average 2.3% |
| Welsh | 44.0 /100 | #179 | Average 2.3% |
| Yugoslavians | 43.9 /100 | #180 | Average 2.3% |
| Jamaicans | 43.5 /100 | #181 | Average 2.3% |
| Belgians | 43.3 /100 | #182 | Average 2.3% |
| Immigrants | Panama | 41.8 /100 | #183 | Average 2.4% |
| Sri Lankans | 41.8 /100 | #184 | Average 2.4% |
| Nigerians | 41.0 /100 | #185 | Average 2.4% |
| Immigrants | Bosnia and Herzegovina | 40.4 /100 | #186 | Average 2.4% |
| Immigrants | Colombia | 34.0 /100 | #187 | Fair 2.4% |
| Hmong | 33.0 /100 | #188 | Fair 2.4% |
| U.S. Virgin Islanders | 31.8 /100 | #189 | Fair 2.4% |
| French | 31.7 /100 | #190 | Fair 2.4% |
| Immigrants | Africa | 30.0 /100 | #191 | Fair 2.4% |
Demographics Similar to Native Hawaiians by Single Father Households
In terms of single father households, the demographic groups most similar to Native Hawaiians are Basque (2.5%, a difference of 0.020%), Delaware (2.5%, a difference of 0.020%), Bahamian (2.5%, a difference of 0.060%), Immigrants from Cameroon (2.5%, a difference of 0.14%), and Immigrants from Middle Africa (2.5%, a difference of 0.23%).
| Demographics | Rating | Rank | Single Father Households |
| Immigrants | Oceania | 5.8 /100 | #239 | Tragic 2.5% |
| Immigrants | Dominica | 4.8 /100 | #240 | Tragic 2.5% |
| Portuguese | 4.1 /100 | #241 | Tragic 2.5% |
| Osage | 4.1 /100 | #242 | Tragic 2.5% |
| Spaniards | 3.1 /100 | #243 | Tragic 2.5% |
| Immigrants | Middle Africa | 2.8 /100 | #244 | Tragic 2.5% |
| Basques | 2.5 /100 | #245 | Tragic 2.5% |
| Native Hawaiians | 2.5 /100 | #246 | Tragic 2.5% |
| Delaware | 2.5 /100 | #247 | Tragic 2.5% |
| Bahamians | 2.4 /100 | #248 | Tragic 2.5% |
| Immigrants | Cameroon | 2.3 /100 | #249 | Tragic 2.5% |
| Somalis | 2.1 /100 | #250 | Tragic 2.5% |
| Liberians | 2.0 /100 | #251 | Tragic 2.5% |
| Immigrants | Eritrea | 2.0 /100 | #252 | Tragic 2.5% |
| Immigrants | Somalia | 1.9 /100 | #253 | Tragic 2.5% |