Sri Lankan vs Immigrants from Ireland Seniors Poverty Over the Age of 75
COMPARE
Sri Lankan
Immigrants from Ireland
Seniors Poverty Over the Age of 75
Seniors Poverty Over the Age of 75 Comparison
Sri Lankans
Immigrants from Ireland
12.4%
SENIORS POVERTY OVER THE AGE OF 75
32.3/ 100
METRIC RATING
186th/ 347
METRIC RANK
11.9%
SENIORS POVERTY OVER THE AGE OF 75
76.2/ 100
METRIC RATING
135th/ 347
METRIC RANK
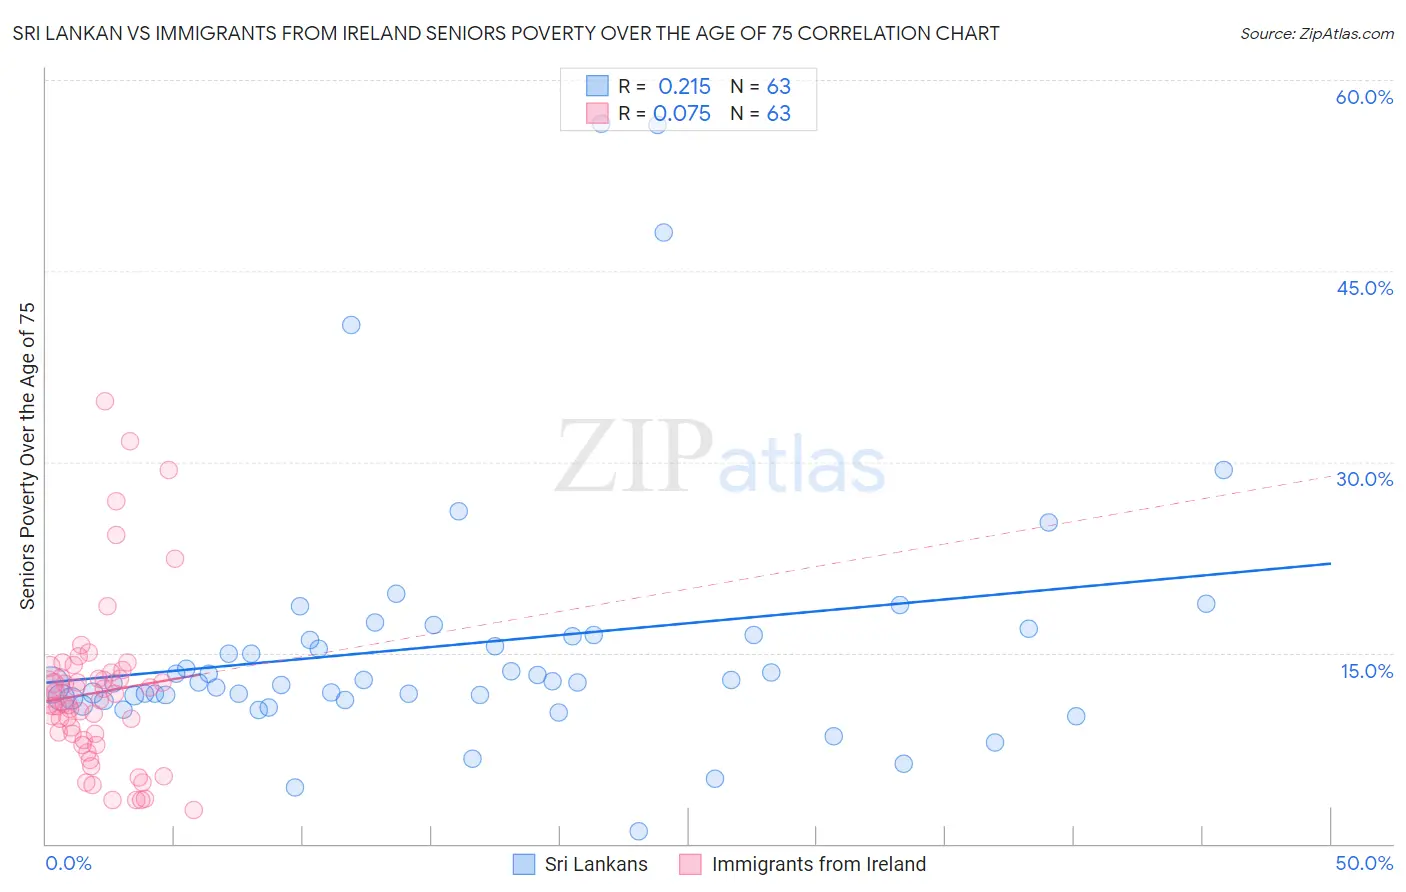
Sri Lankan vs Immigrants from Ireland Seniors Poverty Over the Age of 75 Correlation Chart
The statistical analysis conducted on geographies consisting of 434,587,181 people shows a weak positive correlation between the proportion of Sri Lankans and poverty level among seniors over the age of 75 in the United States with a correlation coefficient (R) of 0.215 and weighted average of 12.4%. Similarly, the statistical analysis conducted on geographies consisting of 239,114,347 people shows a slight positive correlation between the proportion of Immigrants from Ireland and poverty level among seniors over the age of 75 in the United States with a correlation coefficient (R) of 0.075 and weighted average of 11.9%, a difference of 4.0%.
Seniors Poverty Over the Age of 75 Correlation Summary
| Measurement | Sri Lankan | Immigrants from Ireland |
| Minimum | 1.0% | 2.6% |
| Maximum | 56.5% | 34.8% |
| Range | 55.5% | 32.2% |
| Mean | 15.6% | 11.9% |
| Median | 12.7% | 11.1% |
| Interquartile 25% (IQ1) | 11.4% | 8.2% |
| Interquartile 75% (IQ3) | 16.4% | 13.4% |
| Interquartile Range (IQR) | 5.0% | 5.2% |
| Standard Deviation (Sample) | 10.4% | 6.5% |
| Standard Deviation (Population) | 10.3% | 6.5% |
Similar Demographics by Seniors Poverty Over the Age of 75
Demographics Similar to Sri Lankans by Seniors Poverty Over the Age of 75
In terms of seniors poverty over the age of 75, the demographic groups most similar to Sri Lankans are Immigrants from Malaysia (12.3%, a difference of 0.31%), Kiowa (12.3%, a difference of 0.32%), Laotian (12.3%, a difference of 0.52%), Yaqui (12.5%, a difference of 0.63%), and Immigrants from Northern Africa (12.5%, a difference of 0.70%).
| Demographics | Rating | Rank | Seniors Poverty Over the Age of 75 |
| Mongolians | 45.5 /100 | #179 | Average 12.2% |
| Immigrants | South Eastern Asia | 44.3 /100 | #180 | Average 12.2% |
| Immigrants | Australia | 44.2 /100 | #181 | Average 12.2% |
| German Russians | 41.4 /100 | #182 | Average 12.3% |
| Laotians | 38.2 /100 | #183 | Fair 12.3% |
| Kiowa | 36.0 /100 | #184 | Fair 12.3% |
| Immigrants | Malaysia | 35.8 /100 | #185 | Fair 12.3% |
| Sri Lankans | 32.3 /100 | #186 | Fair 12.4% |
| Yaqui | 25.9 /100 | #187 | Fair 12.5% |
| Immigrants | Northern Africa | 25.2 /100 | #188 | Fair 12.5% |
| Immigrants | Indonesia | 24.4 /100 | #189 | Fair 12.5% |
| Immigrants | Congo | 23.9 /100 | #190 | Fair 12.5% |
| Liberians | 23.2 /100 | #191 | Fair 12.5% |
| Choctaw | 20.2 /100 | #192 | Fair 12.5% |
| Taiwanese | 17.8 /100 | #193 | Poor 12.6% |
Demographics Similar to Immigrants from Ireland by Seniors Poverty Over the Age of 75
In terms of seniors poverty over the age of 75, the demographic groups most similar to Immigrants from Ireland are Ugandan (11.9%, a difference of 0.10%), Immigrants from Philippines (11.9%, a difference of 0.14%), Immigrants from Sierra Leone (11.9%, a difference of 0.16%), Immigrants from Moldova (11.9%, a difference of 0.23%), and Lebanese (11.9%, a difference of 0.25%).
| Demographics | Rating | Rank | Seniors Poverty Over the Age of 75 |
| Immigrants | Hungary | 81.7 /100 | #128 | Excellent 11.8% |
| Ethiopians | 80.7 /100 | #129 | Excellent 11.8% |
| Spanish | 80.5 /100 | #130 | Excellent 11.8% |
| Immigrants | Western Europe | 79.6 /100 | #131 | Good 11.9% |
| Lebanese | 78.3 /100 | #132 | Good 11.9% |
| Immigrants | Sierra Leone | 77.6 /100 | #133 | Good 11.9% |
| Ugandans | 77.1 /100 | #134 | Good 11.9% |
| Immigrants | Ireland | 76.2 /100 | #135 | Good 11.9% |
| Immigrants | Philippines | 75.0 /100 | #136 | Good 11.9% |
| Immigrants | Moldova | 74.1 /100 | #137 | Good 11.9% |
| Immigrants | Romania | 72.6 /100 | #138 | Good 11.9% |
| Immigrants | Kenya | 72.6 /100 | #139 | Good 11.9% |
| Immigrants | Pakistan | 71.9 /100 | #140 | Good 12.0% |
| Immigrants | Cameroon | 71.7 /100 | #141 | Good 12.0% |
| Immigrants | Laos | 71.5 /100 | #142 | Good 12.0% |