Sri Lankan vs Delaware Family Households with Children
COMPARE
Sri Lankan
Delaware
Family Households with Children
Family Households with Children Comparison
Sri Lankans
Delaware
29.5%
FAMILY HOUSEHOLDS WITH CHILDREN
100.0/ 100
METRIC RATING
26th/ 347
METRIC RANK
27.4%
FAMILY HOUSEHOLDS WITH CHILDREN
42.0/ 100
METRIC RATING
185th/ 347
METRIC RANK
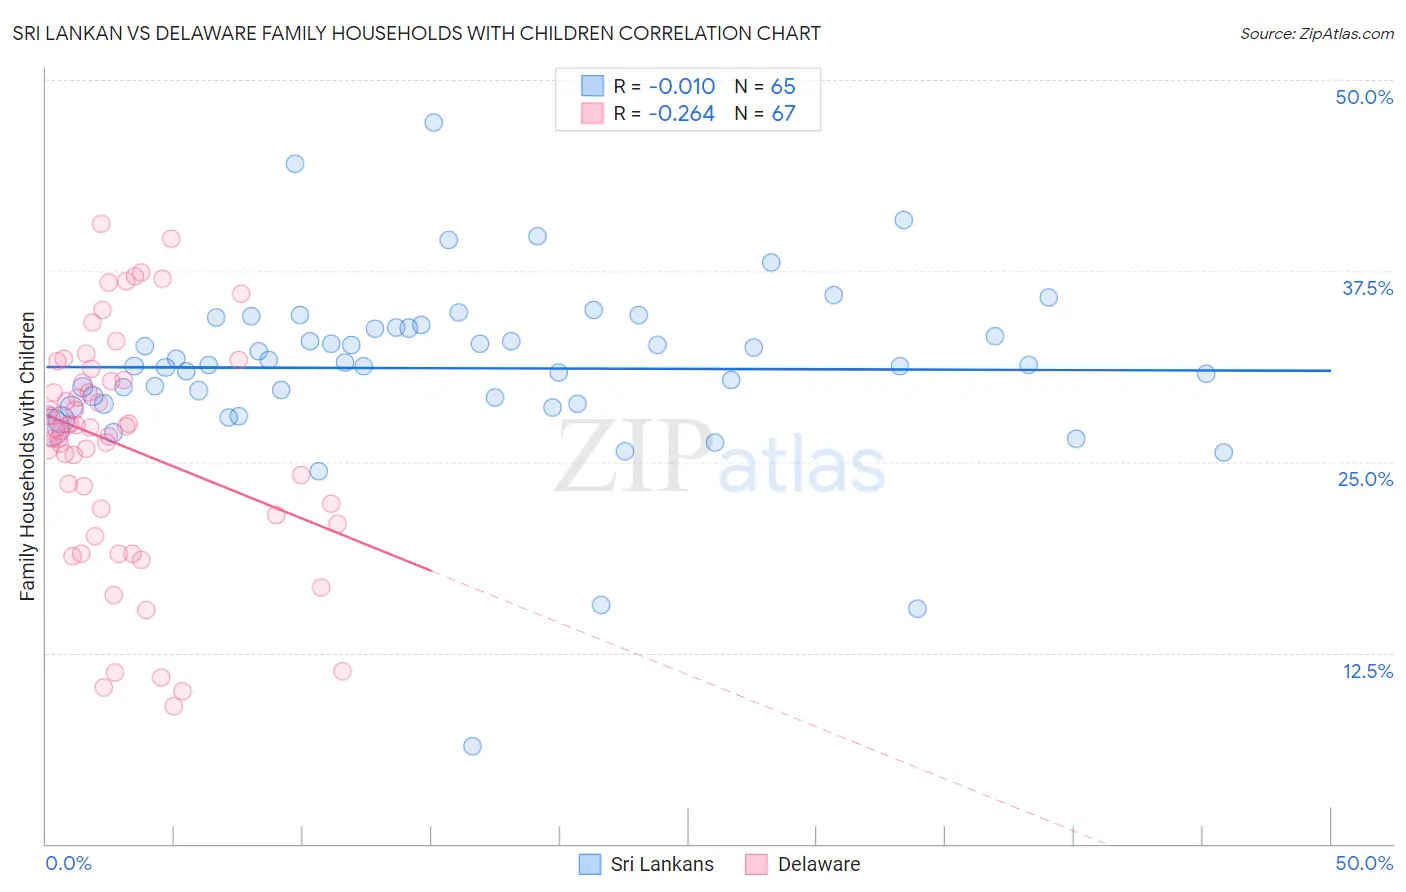
Sri Lankan vs Delaware Family Households with Children Correlation Chart
The statistical analysis conducted on geographies consisting of 439,896,469 people shows no correlation between the proportion of Sri Lankans and percentage of family households with children in the United States with a correlation coefficient (R) of -0.010 and weighted average of 29.5%. Similarly, the statistical analysis conducted on geographies consisting of 96,220,532 people shows a weak negative correlation between the proportion of Delaware and percentage of family households with children in the United States with a correlation coefficient (R) of -0.264 and weighted average of 27.4%, a difference of 7.8%.
Family Households with Children Correlation Summary
| Measurement | Sri Lankan | Delaware |
| Minimum | 6.4% | 9.0% |
| Maximum | 47.2% | 40.6% |
| Range | 40.8% | 31.6% |
| Mean | 31.1% | 26.1% |
| Median | 31.3% | 27.2% |
| Interquartile 25% (IQ1) | 28.8% | 21.5% |
| Interquartile 75% (IQ3) | 33.8% | 30.3% |
| Interquartile Range (IQR) | 5.0% | 8.8% |
| Standard Deviation (Sample) | 5.9% | 7.5% |
| Standard Deviation (Population) | 5.9% | 7.5% |
Similar Demographics by Family Households with Children
Demographics Similar to Sri Lankans by Family Households with Children
In terms of family households with children, the demographic groups most similar to Sri Lankans are Immigrants from Vietnam (29.5%, a difference of 0.030%), Samoan (29.5%, a difference of 0.18%), Bolivian (29.5%, a difference of 0.19%), Yuman (29.5%, a difference of 0.22%), and Japanese (29.4%, a difference of 0.36%).
| Demographics | Rating | Rank | Family Households with Children |
| Alaska Natives | 100.0 /100 | #19 | Exceptional 29.9% |
| Immigrants | El Salvador | 100.0 /100 | #20 | Exceptional 29.8% |
| Immigrants | Laos | 100.0 /100 | #21 | Exceptional 29.8% |
| Malaysians | 100.0 /100 | #22 | Exceptional 29.8% |
| Mexican American Indians | 100.0 /100 | #23 | Exceptional 29.7% |
| Guamanians/Chamorros | 100.0 /100 | #24 | Exceptional 29.7% |
| Immigrants | Latin America | 100.0 /100 | #25 | Exceptional 29.7% |
| Sri Lankans | 100.0 /100 | #26 | Exceptional 29.5% |
| Immigrants | Vietnam | 100.0 /100 | #27 | Exceptional 29.5% |
| Samoans | 100.0 /100 | #28 | Exceptional 29.5% |
| Bolivians | 100.0 /100 | #29 | Exceptional 29.5% |
| Yuman | 100.0 /100 | #30 | Exceptional 29.5% |
| Japanese | 100.0 /100 | #31 | Exceptional 29.4% |
| Immigrants | Yemen | 100.0 /100 | #32 | Exceptional 29.4% |
| Venezuelans | 100.0 /100 | #33 | Exceptional 29.4% |
Demographics Similar to Delaware by Family Households with Children
In terms of family households with children, the demographic groups most similar to Delaware are Immigrants from Brazil (27.4%, a difference of 0.030%), Creek (27.4%, a difference of 0.050%), South African (27.4%, a difference of 0.060%), Native Hawaiian (27.4%, a difference of 0.060%), and Dutch (27.4%, a difference of 0.070%).
| Demographics | Rating | Rank | Family Households with Children |
| Spanish Americans | 48.9 /100 | #178 | Average 27.4% |
| Turks | 46.9 /100 | #179 | Average 27.4% |
| Immigrants | Turkey | 46.9 /100 | #180 | Average 27.4% |
| Aleuts | 46.7 /100 | #181 | Average 27.4% |
| Puget Sound Salish | 46.2 /100 | #182 | Average 27.4% |
| South Africans | 44.9 /100 | #183 | Average 27.4% |
| Native Hawaiians | 44.6 /100 | #184 | Average 27.4% |
| Delaware | 42.0 /100 | #185 | Average 27.4% |
| Immigrants | Brazil | 40.6 /100 | #186 | Average 27.4% |
| Creek | 39.8 /100 | #187 | Fair 27.4% |
| Dutch | 38.8 /100 | #188 | Fair 27.4% |
| Immigrants | Israel | 37.9 /100 | #189 | Fair 27.4% |
| Immigrants | Uruguay | 37.7 /100 | #190 | Fair 27.4% |
| Sudanese | 37.6 /100 | #191 | Fair 27.4% |
| Pennsylvania Germans | 37.5 /100 | #192 | Fair 27.4% |