Spanish American Indian vs Assyrian/Chaldean/Syriac Single Father Households
COMPARE
Spanish American Indian
Assyrian/Chaldean/Syriac
Single Father Households
Single Father Households Comparison
Spanish American Indians
Assyrians/Chaldeans/Syriacs
2.9%
SINGLE FATHER HOUSEHOLDS
0.0/ 100
METRIC RATING
311th/ 347
METRIC RANK
2.0%
SINGLE FATHER HOUSEHOLDS
100.0/ 100
METRIC RATING
26th/ 347
METRIC RANK
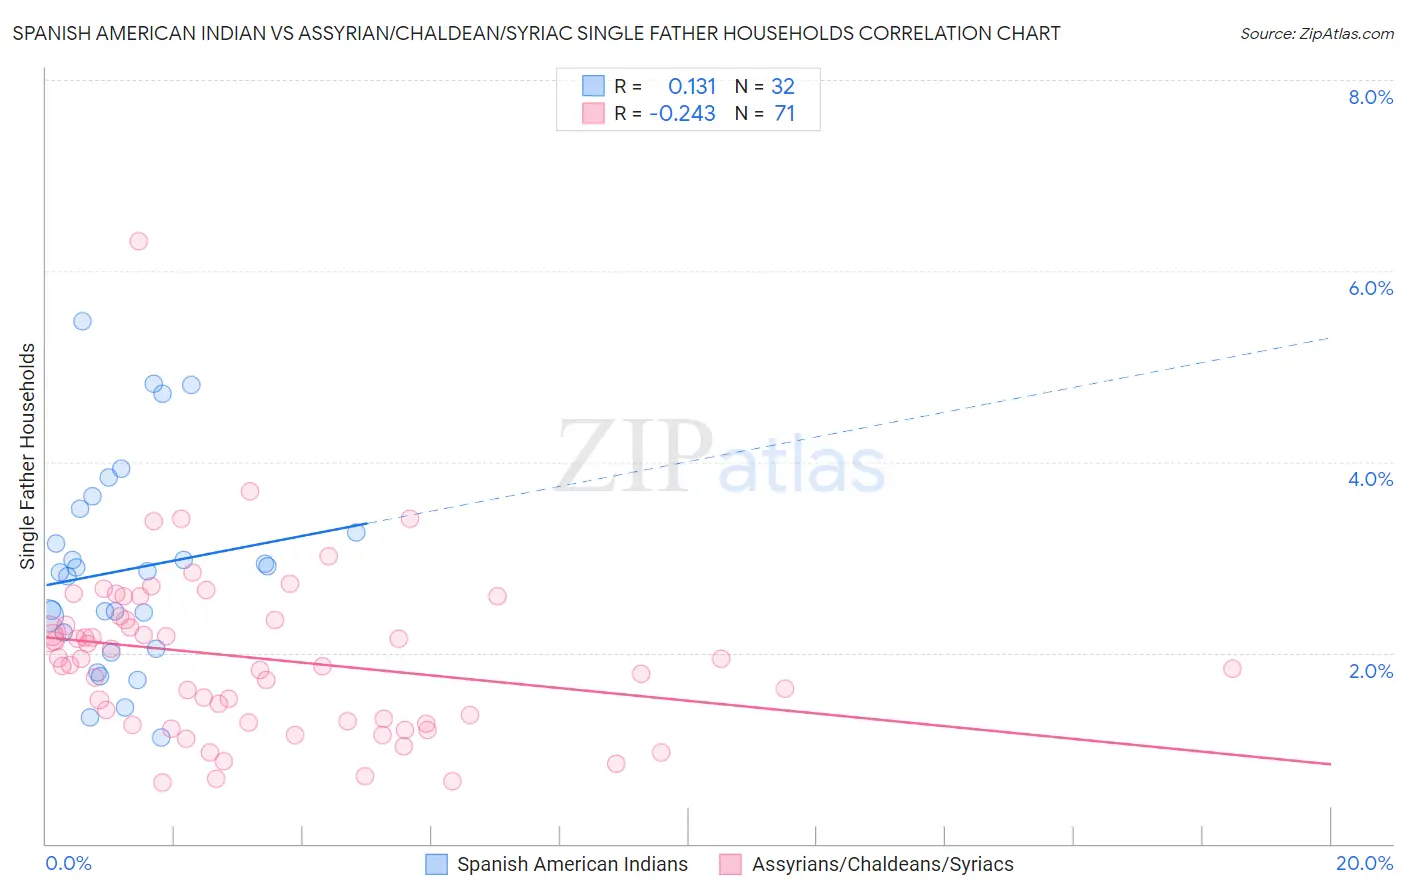
Spanish American Indian vs Assyrian/Chaldean/Syriac Single Father Households Correlation Chart
The statistical analysis conducted on geographies consisting of 73,114,798 people shows a poor positive correlation between the proportion of Spanish American Indians and percentage of single father households in the United States with a correlation coefficient (R) of 0.131 and weighted average of 2.9%. Similarly, the statistical analysis conducted on geographies consisting of 110,024,022 people shows a weak negative correlation between the proportion of Assyrians/Chaldeans/Syriacs and percentage of single father households in the United States with a correlation coefficient (R) of -0.243 and weighted average of 2.0%, a difference of 46.7%.
Single Father Households Correlation Summary
| Measurement | Spanish American Indian | Assyrian/Chaldean/Syriac |
| Minimum | 1.1% | 0.64% |
| Maximum | 5.5% | 6.3% |
| Range | 4.4% | 5.7% |
| Mean | 2.9% | 1.9% |
| Median | 2.8% | 1.9% |
| Interquartile 25% (IQ1) | 2.1% | 1.3% |
| Interquartile 75% (IQ3) | 3.4% | 2.3% |
| Interquartile Range (IQR) | 1.3% | 1.1% |
| Standard Deviation (Sample) | 1.1% | 0.89% |
| Standard Deviation (Population) | 1.0% | 0.88% |
Similar Demographics by Single Father Households
Demographics Similar to Spanish American Indians by Single Father Households
In terms of single father households, the demographic groups most similar to Spanish American Indians are Immigrants from Laos (2.9%, a difference of 0.48%), Tsimshian (2.9%, a difference of 0.57%), Central American (2.9%, a difference of 0.69%), Arapaho (2.9%, a difference of 0.99%), and Salvadoran (2.9%, a difference of 1.2%).
| Demographics | Rating | Rank | Single Father Households |
| Mexican American Indians | 0.0 /100 | #304 | Tragic 2.8% |
| Hispanics or Latinos | 0.0 /100 | #305 | Tragic 2.8% |
| Immigrants | Azores | 0.0 /100 | #306 | Tragic 2.8% |
| Hopi | 0.0 /100 | #307 | Tragic 2.8% |
| Apache | 0.0 /100 | #308 | Tragic 2.8% |
| Central Americans | 0.0 /100 | #309 | Tragic 2.9% |
| Immigrants | Laos | 0.0 /100 | #310 | Tragic 2.9% |
| Spanish American Indians | 0.0 /100 | #311 | Tragic 2.9% |
| Tsimshian | 0.0 /100 | #312 | Tragic 2.9% |
| Arapaho | 0.0 /100 | #313 | Tragic 2.9% |
| Salvadorans | 0.0 /100 | #314 | Tragic 2.9% |
| Cheyenne | 0.0 /100 | #315 | Tragic 2.9% |
| Houma | 0.0 /100 | #316 | Tragic 2.9% |
| Immigrants | El Salvador | 0.0 /100 | #317 | Tragic 2.9% |
| Cape Verdeans | 0.0 /100 | #318 | Tragic 2.9% |
Demographics Similar to Assyrians/Chaldeans/Syriacs by Single Father Households
In terms of single father households, the demographic groups most similar to Assyrians/Chaldeans/Syriacs are Eastern European (2.0%, a difference of 0.14%), Immigrants from Croatia (2.0%, a difference of 0.15%), Immigrants from Russia (2.0%, a difference of 0.15%), Immigrants from South Central Asia (2.0%, a difference of 0.28%), and Immigrants from Japan (2.0%, a difference of 0.47%).
| Demographics | Rating | Rank | Single Father Households |
| Iranians | 100.0 /100 | #19 | Exceptional 1.9% |
| Thais | 100.0 /100 | #20 | Exceptional 1.9% |
| Immigrants | Albania | 100.0 /100 | #21 | Exceptional 1.9% |
| Immigrants | Latvia | 100.0 /100 | #22 | Exceptional 1.9% |
| Immigrants | Croatia | 100.0 /100 | #23 | Exceptional 2.0% |
| Immigrants | Russia | 100.0 /100 | #24 | Exceptional 2.0% |
| Eastern Europeans | 100.0 /100 | #25 | Exceptional 2.0% |
| Assyrians/Chaldeans/Syriacs | 100.0 /100 | #26 | Exceptional 2.0% |
| Immigrants | South Central Asia | 100.0 /100 | #27 | Exceptional 2.0% |
| Immigrants | Japan | 100.0 /100 | #28 | Exceptional 2.0% |
| Bulgarians | 100.0 /100 | #29 | Exceptional 2.0% |
| Cambodians | 100.0 /100 | #30 | Exceptional 2.0% |
| Israelis | 100.0 /100 | #31 | Exceptional 2.0% |
| Chinese | 100.0 /100 | #32 | Exceptional 2.0% |
| Turks | 100.0 /100 | #33 | Exceptional 2.0% |