Portuguese vs Liberian Divorced or Separated
COMPARE
Portuguese
Liberian
Divorced or Separated
Divorced or Separated Comparison
Portuguese
Liberians
12.2%
DIVORCED OR SEPARATED
23.5/ 100
METRIC RATING
202nd/ 347
METRIC RANK
12.6%
DIVORCED OR SEPARATED
0.9/ 100
METRIC RATING
252nd/ 347
METRIC RANK
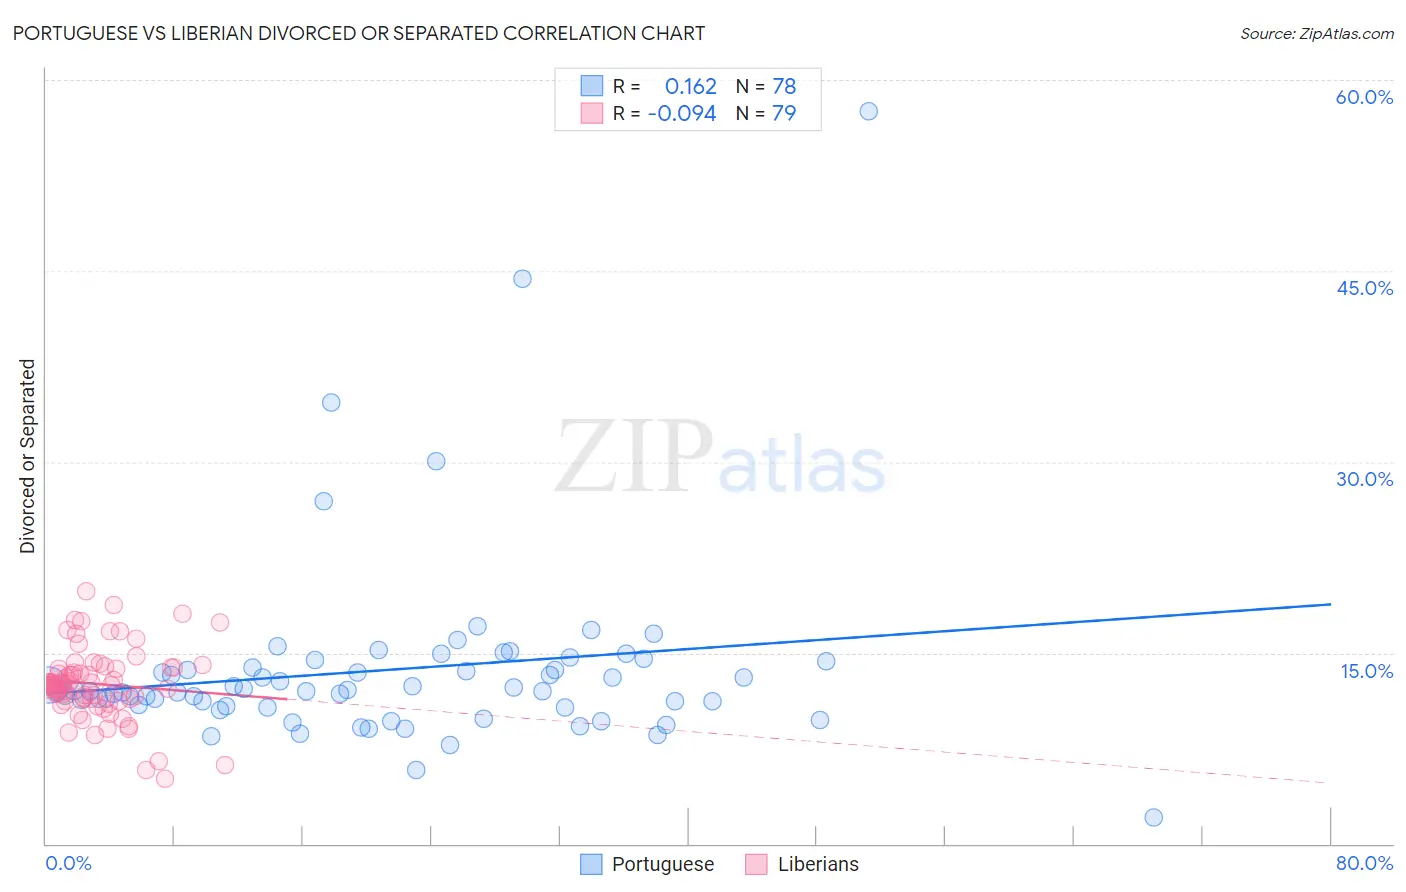
Portuguese vs Liberian Divorced or Separated Correlation Chart
The statistical analysis conducted on geographies consisting of 450,104,326 people shows a poor positive correlation between the proportion of Portuguese and percentage of population currently divorced or separated in the United States with a correlation coefficient (R) of 0.162 and weighted average of 12.2%. Similarly, the statistical analysis conducted on geographies consisting of 118,063,038 people shows a slight negative correlation between the proportion of Liberians and percentage of population currently divorced or separated in the United States with a correlation coefficient (R) of -0.094 and weighted average of 12.6%, a difference of 3.1%.
Divorced or Separated Correlation Summary
| Measurement | Portuguese | Liberian |
| Minimum | 2.1% | 5.1% |
| Maximum | 57.5% | 19.8% |
| Range | 55.4% | 14.7% |
| Mean | 13.6% | 12.6% |
| Median | 12.0% | 12.5% |
| Interquartile 25% (IQ1) | 10.8% | 11.3% |
| Interquartile 75% (IQ3) | 13.9% | 13.8% |
| Interquartile Range (IQR) | 3.1% | 2.5% |
| Standard Deviation (Sample) | 7.6% | 2.8% |
| Standard Deviation (Population) | 7.5% | 2.8% |
Similar Demographics by Divorced or Separated
Demographics Similar to Portuguese by Divorced or Separated
In terms of divorced or separated, the demographic groups most similar to Portuguese are Immigrants from Guatemala (12.2%, a difference of 0.020%), Kenyan (12.2%, a difference of 0.080%), Immigrants from Costa Rica (12.2%, a difference of 0.11%), Slovak (12.2%, a difference of 0.12%), and Mexican (12.2%, a difference of 0.13%).
| Demographics | Rating | Rank | Divorced or Separated |
| Immigrants | England | 31.4 /100 | #195 | Fair 12.1% |
| Immigrants | Burma/Myanmar | 30.4 /100 | #196 | Fair 12.1% |
| Immigrants | Africa | 30.3 /100 | #197 | Fair 12.1% |
| Nigerians | 30.1 /100 | #198 | Fair 12.1% |
| Central Americans | 29.4 /100 | #199 | Fair 12.1% |
| South Americans | 28.6 /100 | #200 | Fair 12.2% |
| Guatemalans | 26.9 /100 | #201 | Fair 12.2% |
| Portuguese | 23.5 /100 | #202 | Fair 12.2% |
| Immigrants | Guatemala | 23.2 /100 | #203 | Fair 12.2% |
| Kenyans | 21.8 /100 | #204 | Fair 12.2% |
| Immigrants | Costa Rica | 21.3 /100 | #205 | Fair 12.2% |
| Slovaks | 21.0 /100 | #206 | Fair 12.2% |
| Mexicans | 21.0 /100 | #207 | Fair 12.2% |
| Immigrants | Ghana | 18.8 /100 | #208 | Poor 12.2% |
| Immigrants | Trinidad and Tobago | 17.8 /100 | #209 | Poor 12.2% |
Demographics Similar to Liberians by Divorced or Separated
In terms of divorced or separated, the demographic groups most similar to Liberians are Somali (12.6%, a difference of 0.0%), Senegalese (12.6%, a difference of 0.060%), Welsh (12.6%, a difference of 0.16%), Immigrants from Colombia (12.6%, a difference of 0.32%), and Irish (12.5%, a difference of 0.33%).
| Demographics | Rating | Rank | Divorced or Separated |
| Hispanics or Latinos | 2.0 /100 | #245 | Tragic 12.5% |
| Immigrants | West Indies | 1.9 /100 | #246 | Tragic 12.5% |
| Germans | 1.8 /100 | #247 | Tragic 12.5% |
| Nepalese | 1.8 /100 | #248 | Tragic 12.5% |
| Finns | 1.8 /100 | #249 | Tragic 12.5% |
| Irish | 1.3 /100 | #250 | Tragic 12.5% |
| Aleuts | 1.3 /100 | #251 | Tragic 12.5% |
| Liberians | 0.9 /100 | #252 | Tragic 12.6% |
| Somalis | 0.9 /100 | #253 | Tragic 12.6% |
| Senegalese | 0.8 /100 | #254 | Tragic 12.6% |
| Welsh | 0.7 /100 | #255 | Tragic 12.6% |
| Immigrants | Colombia | 0.6 /100 | #256 | Tragic 12.6% |
| Immigrants | Somalia | 0.6 /100 | #257 | Tragic 12.6% |
| Indonesians | 0.6 /100 | #258 | Tragic 12.6% |
| Yuman | 0.6 /100 | #259 | Tragic 12.6% |