Soviet Union vs Immigrants from Burma/Myanmar Single Father Households
COMPARE
Soviet Union
Immigrants from Burma/Myanmar
Single Father Households
Single Father Households Comparison
Soviet Union
Immigrants from Burma/Myanmar
1.8%
SINGLE FATHER HOUSEHOLDS
100.0/ 100
METRIC RATING
1st/ 347
METRIC RANK
2.4%
SINGLE FATHER HOUSEHOLDS
12.1/ 100
METRIC RATING
221st/ 347
METRIC RANK
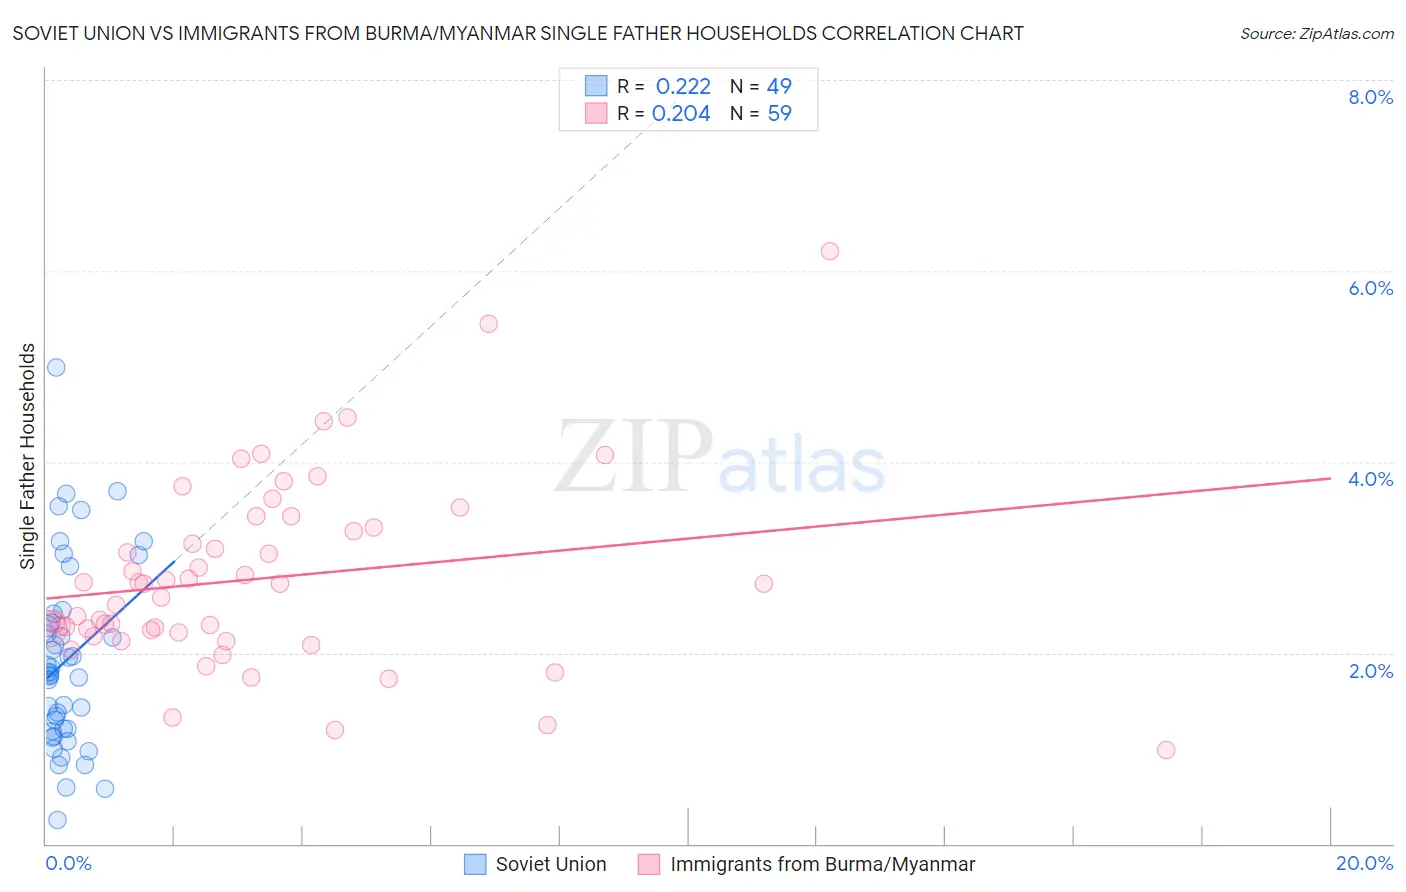
Soviet Union vs Immigrants from Burma/Myanmar Single Father Households Correlation Chart
The statistical analysis conducted on geographies consisting of 43,425,505 people shows a weak positive correlation between the proportion of Soviet Union and percentage of single father households in the United States with a correlation coefficient (R) of 0.222 and weighted average of 1.8%. Similarly, the statistical analysis conducted on geographies consisting of 171,785,459 people shows a weak positive correlation between the proportion of Immigrants from Burma/Myanmar and percentage of single father households in the United States with a correlation coefficient (R) of 0.204 and weighted average of 2.4%, a difference of 35.0%.
Single Father Households Correlation Summary
| Measurement | Soviet Union | Immigrants from Burma/Myanmar |
| Minimum | 0.25% | 0.98% |
| Maximum | 5.0% | 6.2% |
| Range | 4.7% | 5.2% |
| Mean | 1.9% | 2.8% |
| Median | 1.8% | 2.7% |
| Interquartile 25% (IQ1) | 1.2% | 2.2% |
| Interquartile 75% (IQ3) | 2.4% | 3.3% |
| Interquartile Range (IQR) | 1.2% | 1.1% |
| Standard Deviation (Sample) | 0.97% | 0.98% |
| Standard Deviation (Population) | 0.96% | 0.97% |
Similar Demographics by Single Father Households
Demographics Similar to Soviet Union by Single Father Households
In terms of single father households, the demographic groups most similar to Soviet Union are Immigrants from Israel (1.8%, a difference of 0.040%), Filipino (1.8%, a difference of 0.46%), Immigrants from Uzbekistan (1.8%, a difference of 1.1%), Immigrants from Hong Kong (1.8%, a difference of 2.1%), and Immigrants from Taiwan (1.8%, a difference of 2.5%).
| Demographics | Rating | Rank | Single Father Households |
| Soviet Union | 100.0 /100 | #1 | Exceptional 1.8% |
| Immigrants | Israel | 100.0 /100 | #2 | Exceptional 1.8% |
| Filipinos | 100.0 /100 | #3 | Exceptional 1.8% |
| Immigrants | Uzbekistan | 100.0 /100 | #4 | Exceptional 1.8% |
| Immigrants | Hong Kong | 100.0 /100 | #5 | Exceptional 1.8% |
| Immigrants | Taiwan | 100.0 /100 | #6 | Exceptional 1.8% |
| Cypriots | 100.0 /100 | #7 | Exceptional 1.8% |
| Immigrants | Ireland | 100.0 /100 | #8 | Exceptional 1.8% |
| Immigrants | China | 100.0 /100 | #9 | Exceptional 1.8% |
| Okinawans | 100.0 /100 | #10 | Exceptional 1.9% |
| Immigrants | Belarus | 100.0 /100 | #11 | Exceptional 1.9% |
| Immigrants | Greece | 100.0 /100 | #12 | Exceptional 1.9% |
| Immigrants | Singapore | 100.0 /100 | #13 | Exceptional 1.9% |
| Immigrants | Lithuania | 100.0 /100 | #14 | Exceptional 1.9% |
| Immigrants | Eastern Asia | 100.0 /100 | #15 | Exceptional 1.9% |
Demographics Similar to Immigrants from Burma/Myanmar by Single Father Households
In terms of single father households, the demographic groups most similar to Immigrants from Burma/Myanmar are Immigrants from Eastern Africa (2.4%, a difference of 0.030%), Ghanaian (2.4%, a difference of 0.13%), Sudanese (2.4%, a difference of 0.14%), Immigrants from Uruguay (2.4%, a difference of 0.19%), and Immigrants from Ethiopia (2.4%, a difference of 0.21%).
| Demographics | Rating | Rank | Single Father Households |
| Ethiopians | 16.6 /100 | #214 | Poor 2.4% |
| Immigrants | South Eastern Asia | 15.9 /100 | #215 | Poor 2.4% |
| Immigrants | Ecuador | 14.9 /100 | #216 | Poor 2.4% |
| Dutch | 14.3 /100 | #217 | Poor 2.4% |
| Immigrants | Ethiopia | 13.4 /100 | #218 | Poor 2.4% |
| Sudanese | 13.0 /100 | #219 | Poor 2.4% |
| Ghanaians | 12.9 /100 | #220 | Poor 2.4% |
| Immigrants | Burma/Myanmar | 12.1 /100 | #221 | Poor 2.4% |
| Immigrants | Eastern Africa | 11.9 /100 | #222 | Poor 2.4% |
| Immigrants | Uruguay | 11.0 /100 | #223 | Poor 2.4% |
| Immigrants | Bahamas | 10.6 /100 | #224 | Poor 2.4% |
| Marshallese | 9.7 /100 | #225 | Tragic 2.4% |
| Blacks/African Americans | 9.7 /100 | #226 | Tragic 2.4% |
| Americans | 9.3 /100 | #227 | Tragic 2.4% |
| Immigrants | Ghana | 9.1 /100 | #228 | Tragic 2.4% |