South American vs Dutch Family Households with Children
COMPARE
South American
Dutch
Family Households with Children
Family Households with Children Comparison
South Americans
Dutch
28.4%
FAMILY HOUSEHOLDS WITH CHILDREN
99.8/ 100
METRIC RATING
81st/ 347
METRIC RANK
27.4%
FAMILY HOUSEHOLDS WITH CHILDREN
38.8/ 100
METRIC RATING
188th/ 347
METRIC RANK
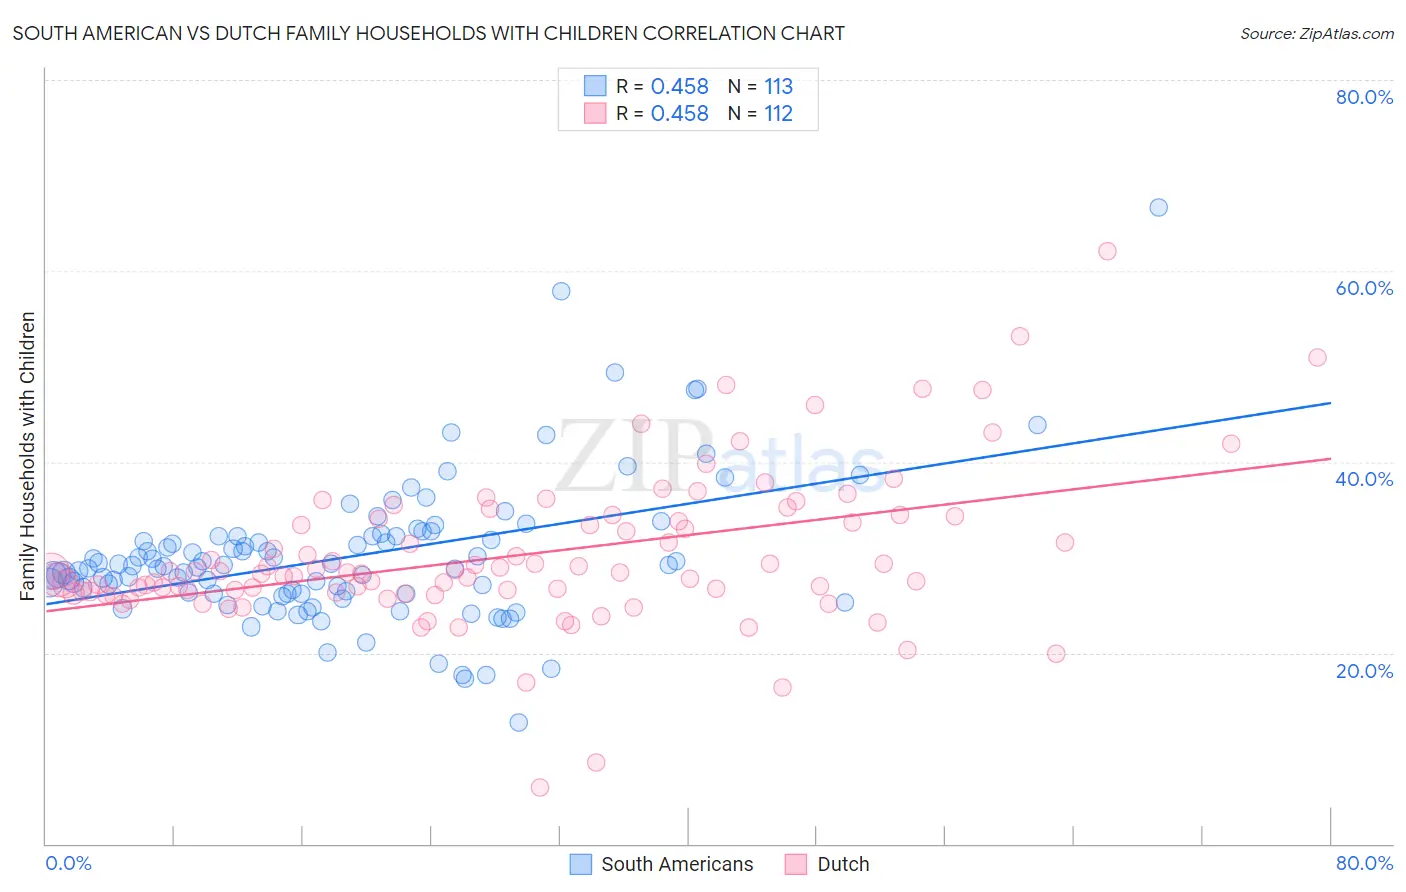
South American vs Dutch Family Households with Children Correlation Chart
The statistical analysis conducted on geographies consisting of 493,371,298 people shows a moderate positive correlation between the proportion of South Americans and percentage of family households with children in the United States with a correlation coefficient (R) of 0.458 and weighted average of 28.4%. Similarly, the statistical analysis conducted on geographies consisting of 553,510,182 people shows a moderate positive correlation between the proportion of Dutch and percentage of family households with children in the United States with a correlation coefficient (R) of 0.458 and weighted average of 27.4%, a difference of 3.7%.
Family Households with Children Correlation Summary
| Measurement | South American | Dutch |
| Minimum | 12.7% | 5.9% |
| Maximum | 66.7% | 62.0% |
| Range | 53.9% | 56.1% |
| Mean | 30.1% | 30.2% |
| Median | 29.1% | 28.4% |
| Interquartile 25% (IQ1) | 26.2% | 26.4% |
| Interquartile 75% (IQ3) | 32.2% | 33.9% |
| Interquartile Range (IQR) | 6.0% | 7.6% |
| Standard Deviation (Sample) | 7.6% | 8.0% |
| Standard Deviation (Population) | 7.5% | 8.0% |
Similar Demographics by Family Households with Children
Demographics Similar to South Americans by Family Households with Children
In terms of family households with children, the demographic groups most similar to South Americans are Native/Alaskan (28.4%, a difference of 0.020%), Immigrants from Iraq (28.4%, a difference of 0.040%), Kenyan (28.4%, a difference of 0.040%), Immigrants from Nepal (28.4%, a difference of 0.060%), and Nicaraguan (28.4%, a difference of 0.090%).
| Demographics | Rating | Rank | Family Households with Children |
| Laotians | 99.9 /100 | #74 | Exceptional 28.5% |
| Immigrants | Jordan | 99.9 /100 | #75 | Exceptional 28.4% |
| Immigrants | Sri Lanka | 99.9 /100 | #76 | Exceptional 28.4% |
| Nigerians | 99.8 /100 | #77 | Exceptional 28.4% |
| Immigrants | Nepal | 99.8 /100 | #78 | Exceptional 28.4% |
| Immigrants | Iraq | 99.8 /100 | #79 | Exceptional 28.4% |
| Natives/Alaskans | 99.8 /100 | #80 | Exceptional 28.4% |
| South Americans | 99.8 /100 | #81 | Exceptional 28.4% |
| Kenyans | 99.8 /100 | #82 | Exceptional 28.4% |
| Nicaraguans | 99.8 /100 | #83 | Exceptional 28.4% |
| Costa Ricans | 99.8 /100 | #84 | Exceptional 28.4% |
| Immigrants | Syria | 99.8 /100 | #85 | Exceptional 28.4% |
| Immigrants | Western Africa | 99.6 /100 | #86 | Exceptional 28.3% |
| Colombians | 99.6 /100 | #87 | Exceptional 28.3% |
| Liberians | 99.6 /100 | #88 | Exceptional 28.3% |
Demographics Similar to Dutch by Family Households with Children
In terms of family households with children, the demographic groups most similar to Dutch are Creek (27.4%, a difference of 0.020%), Immigrants from Israel (27.4%, a difference of 0.020%), Immigrants from Uruguay (27.4%, a difference of 0.030%), Sudanese (27.4%, a difference of 0.030%), and Pennsylvania German (27.4%, a difference of 0.030%).
| Demographics | Rating | Rank | Family Households with Children |
| Aleuts | 46.7 /100 | #181 | Average 27.4% |
| Puget Sound Salish | 46.2 /100 | #182 | Average 27.4% |
| South Africans | 44.9 /100 | #183 | Average 27.4% |
| Native Hawaiians | 44.6 /100 | #184 | Average 27.4% |
| Delaware | 42.0 /100 | #185 | Average 27.4% |
| Immigrants | Brazil | 40.6 /100 | #186 | Average 27.4% |
| Creek | 39.8 /100 | #187 | Fair 27.4% |
| Dutch | 38.8 /100 | #188 | Fair 27.4% |
| Immigrants | Israel | 37.9 /100 | #189 | Fair 27.4% |
| Immigrants | Uruguay | 37.7 /100 | #190 | Fair 27.4% |
| Sudanese | 37.6 /100 | #191 | Fair 27.4% |
| Pennsylvania Germans | 37.5 /100 | #192 | Fair 27.4% |
| Swedes | 36.9 /100 | #193 | Fair 27.4% |
| Immigrants | Iran | 36.1 /100 | #194 | Fair 27.4% |
| Crow | 35.7 /100 | #195 | Fair 27.4% |