Immigrants from Micronesia vs Dutch Family Households with Children
COMPARE
Immigrants from Micronesia
Dutch
Family Households with Children
Family Households with Children Comparison
Immigrants from Micronesia
Dutch
27.2%
FAMILY HOUSEHOLDS WITH CHILDREN
20.2/ 100
METRIC RATING
206th/ 347
METRIC RANK
27.4%
FAMILY HOUSEHOLDS WITH CHILDREN
38.8/ 100
METRIC RATING
188th/ 347
METRIC RANK
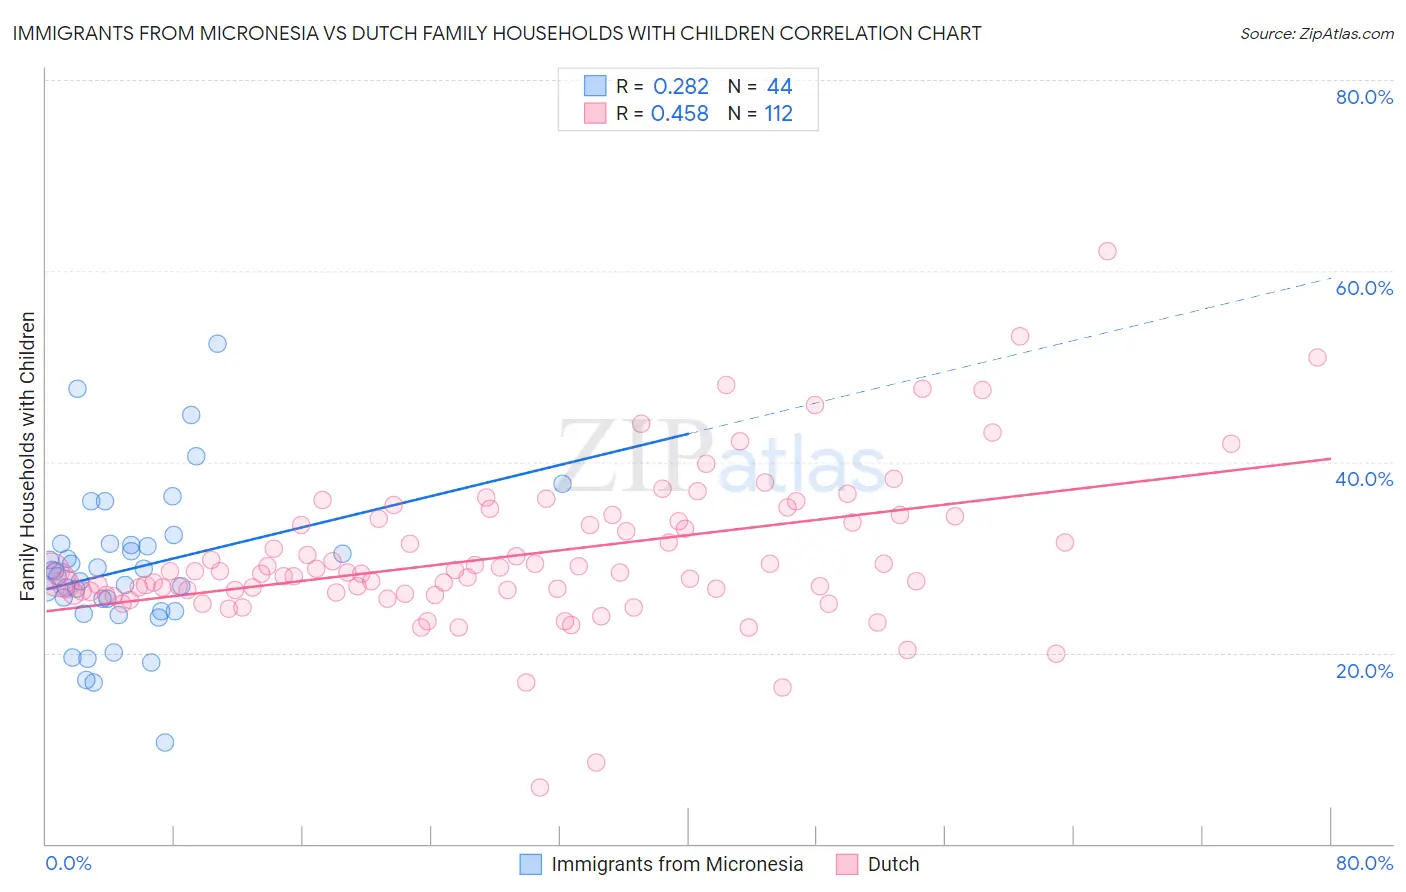
Immigrants from Micronesia vs Dutch Family Households with Children Correlation Chart
The statistical analysis conducted on geographies consisting of 61,601,070 people shows a weak positive correlation between the proportion of Immigrants from Micronesia and percentage of family households with children in the United States with a correlation coefficient (R) of 0.282 and weighted average of 27.2%. Similarly, the statistical analysis conducted on geographies consisting of 553,510,182 people shows a moderate positive correlation between the proportion of Dutch and percentage of family households with children in the United States with a correlation coefficient (R) of 0.458 and weighted average of 27.4%, a difference of 0.51%.
Family Households with Children Correlation Summary
| Measurement | Immigrants from Micronesia | Dutch |
| Minimum | 10.6% | 5.9% |
| Maximum | 52.3% | 62.0% |
| Range | 41.7% | 56.1% |
| Mean | 28.7% | 30.2% |
| Median | 28.3% | 28.4% |
| Interquartile 25% (IQ1) | 24.3% | 26.4% |
| Interquartile 75% (IQ3) | 31.4% | 33.9% |
| Interquartile Range (IQR) | 7.0% | 7.6% |
| Standard Deviation (Sample) | 7.9% | 8.0% |
| Standard Deviation (Population) | 7.9% | 8.0% |
Demographics Similar to Immigrants from Micronesia and Dutch by Family Households with Children
In terms of family households with children, the demographic groups most similar to Immigrants from Micronesia are Immigrants from Haiti (27.2%, a difference of 0.0%), Haitian (27.2%, a difference of 0.010%), Immigrants from Sudan (27.3%, a difference of 0.050%), Kiowa (27.3%, a difference of 0.070%), and American (27.3%, a difference of 0.090%). Similarly, the demographic groups most similar to Dutch are Creek (27.4%, a difference of 0.020%), Immigrants from Israel (27.4%, a difference of 0.020%), Immigrants from Uruguay (27.4%, a difference of 0.030%), Sudanese (27.4%, a difference of 0.030%), and Pennsylvania German (27.4%, a difference of 0.030%).
| Demographics | Rating | Rank | Family Households with Children |
| Creek | 39.8 /100 | #187 | Fair 27.4% |
| Dutch | 38.8 /100 | #188 | Fair 27.4% |
| Immigrants | Israel | 37.9 /100 | #189 | Fair 27.4% |
| Immigrants | Uruguay | 37.7 /100 | #190 | Fair 27.4% |
| Sudanese | 37.6 /100 | #191 | Fair 27.4% |
| Pennsylvania Germans | 37.5 /100 | #192 | Fair 27.4% |
| Swedes | 36.9 /100 | #193 | Fair 27.4% |
| Immigrants | Iran | 36.1 /100 | #194 | Fair 27.4% |
| Crow | 35.7 /100 | #195 | Fair 27.4% |
| Cheyenne | 35.1 /100 | #196 | Fair 27.4% |
| Norwegians | 35.0 /100 | #197 | Fair 27.4% |
| Immigrants | Romania | 34.4 /100 | #198 | Fair 27.4% |
| English | 32.0 /100 | #199 | Fair 27.3% |
| Immigrants | Congo | 28.7 /100 | #200 | Fair 27.3% |
| Bhutanese | 25.1 /100 | #201 | Fair 27.3% |
| Americans | 22.8 /100 | #202 | Fair 27.3% |
| Kiowa | 22.2 /100 | #203 | Fair 27.3% |
| Immigrants | Sudan | 21.6 /100 | #204 | Fair 27.3% |
| Immigrants | Haiti | 20.3 /100 | #205 | Fair 27.2% |
| Immigrants | Micronesia | 20.2 /100 | #206 | Fair 27.2% |
| Haitians | 19.8 /100 | #207 | Poor 27.2% |