South American vs Jamaican Family Households with Children
COMPARE
South American
Jamaican
Family Households with Children
Family Households with Children Comparison
South Americans
Jamaicans
28.4%
FAMILY HOUSEHOLDS WITH CHILDREN
99.8/ 100
METRIC RATING
81st/ 347
METRIC RANK
26.9%
FAMILY HOUSEHOLDS WITH CHILDREN
2.5/ 100
METRIC RATING
246th/ 347
METRIC RANK
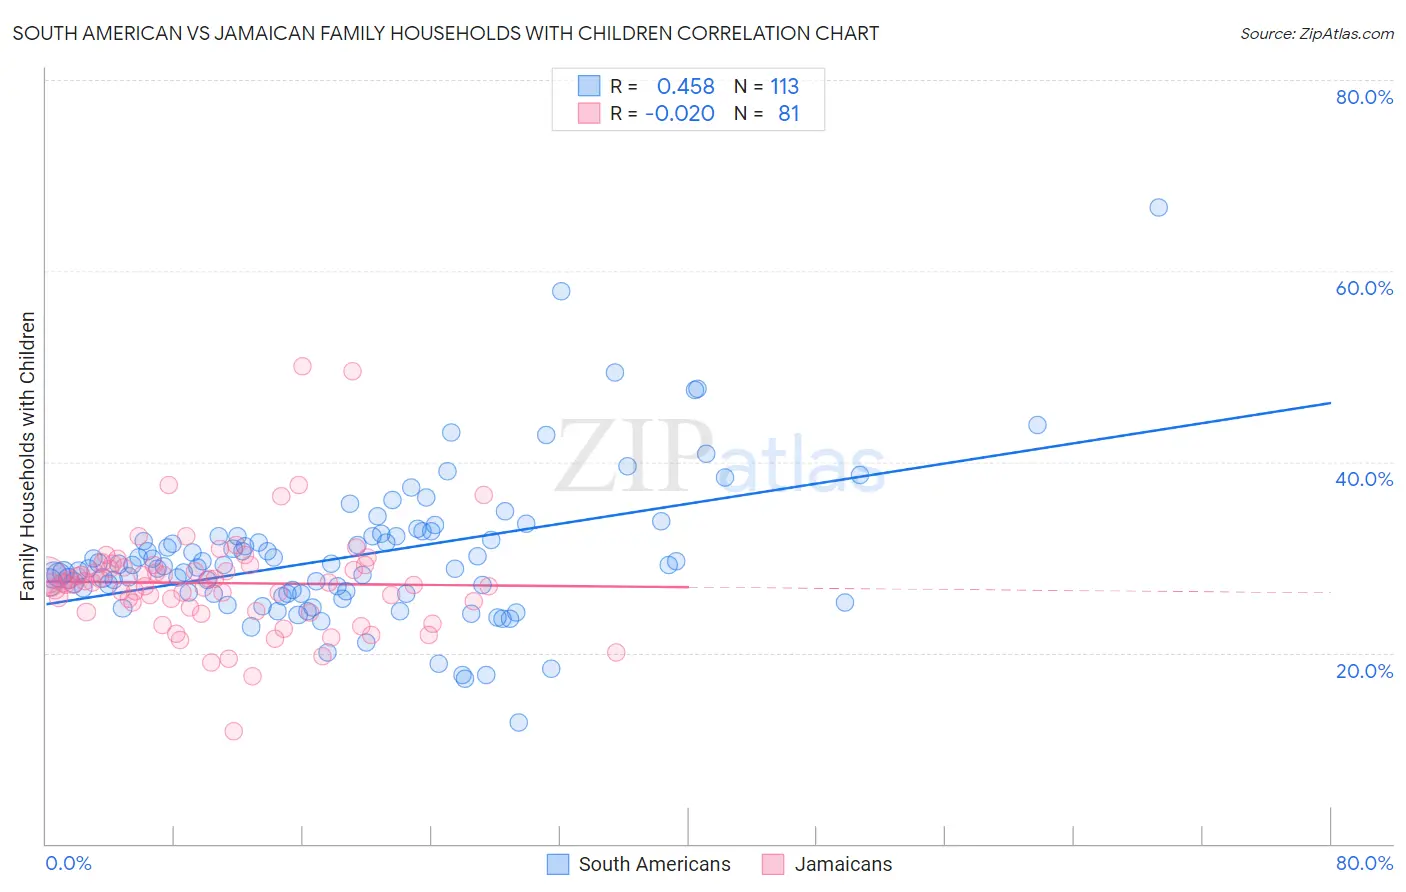
South American vs Jamaican Family Households with Children Correlation Chart
The statistical analysis conducted on geographies consisting of 493,371,298 people shows a moderate positive correlation between the proportion of South Americans and percentage of family households with children in the United States with a correlation coefficient (R) of 0.458 and weighted average of 28.4%. Similarly, the statistical analysis conducted on geographies consisting of 367,528,470 people shows no correlation between the proportion of Jamaicans and percentage of family households with children in the United States with a correlation coefficient (R) of -0.020 and weighted average of 26.9%, a difference of 5.6%.
Family Households with Children Correlation Summary
| Measurement | South American | Jamaican |
| Minimum | 12.7% | 11.8% |
| Maximum | 66.7% | 50.0% |
| Range | 53.9% | 38.2% |
| Mean | 30.1% | 27.3% |
| Median | 29.1% | 27.2% |
| Interquartile 25% (IQ1) | 26.2% | 24.5% |
| Interquartile 75% (IQ3) | 32.2% | 29.1% |
| Interquartile Range (IQR) | 6.0% | 4.5% |
| Standard Deviation (Sample) | 7.6% | 5.5% |
| Standard Deviation (Population) | 7.5% | 5.5% |
Similar Demographics by Family Households with Children
Demographics Similar to South Americans by Family Households with Children
In terms of family households with children, the demographic groups most similar to South Americans are Native/Alaskan (28.4%, a difference of 0.020%), Immigrants from Iraq (28.4%, a difference of 0.040%), Kenyan (28.4%, a difference of 0.040%), Immigrants from Nepal (28.4%, a difference of 0.060%), and Nicaraguan (28.4%, a difference of 0.090%).
| Demographics | Rating | Rank | Family Households with Children |
| Laotians | 99.9 /100 | #74 | Exceptional 28.5% |
| Immigrants | Jordan | 99.9 /100 | #75 | Exceptional 28.4% |
| Immigrants | Sri Lanka | 99.9 /100 | #76 | Exceptional 28.4% |
| Nigerians | 99.8 /100 | #77 | Exceptional 28.4% |
| Immigrants | Nepal | 99.8 /100 | #78 | Exceptional 28.4% |
| Immigrants | Iraq | 99.8 /100 | #79 | Exceptional 28.4% |
| Natives/Alaskans | 99.8 /100 | #80 | Exceptional 28.4% |
| South Americans | 99.8 /100 | #81 | Exceptional 28.4% |
| Kenyans | 99.8 /100 | #82 | Exceptional 28.4% |
| Nicaraguans | 99.8 /100 | #83 | Exceptional 28.4% |
| Costa Ricans | 99.8 /100 | #84 | Exceptional 28.4% |
| Immigrants | Syria | 99.8 /100 | #85 | Exceptional 28.4% |
| Immigrants | Western Africa | 99.6 /100 | #86 | Exceptional 28.3% |
| Colombians | 99.6 /100 | #87 | Exceptional 28.3% |
| Liberians | 99.6 /100 | #88 | Exceptional 28.3% |
Demographics Similar to Jamaicans by Family Households with Children
In terms of family households with children, the demographic groups most similar to Jamaicans are Potawatomi (26.9%, a difference of 0.060%), Australian (26.9%, a difference of 0.070%), Immigrants from Kazakhstan (26.9%, a difference of 0.070%), Ukrainian (26.9%, a difference of 0.090%), and Immigrants from Eastern Europe (26.9%, a difference of 0.090%).
| Demographics | Rating | Rank | Family Households with Children |
| Immigrants | Southern Europe | 3.4 /100 | #239 | Tragic 26.9% |
| Immigrants | Bulgaria | 3.3 /100 | #240 | Tragic 26.9% |
| Navajo | 3.2 /100 | #241 | Tragic 26.9% |
| Immigrants | England | 3.2 /100 | #242 | Tragic 26.9% |
| Immigrants | Saudi Arabia | 2.9 /100 | #243 | Tragic 26.9% |
| Ukrainians | 2.9 /100 | #244 | Tragic 26.9% |
| Australians | 2.8 /100 | #245 | Tragic 26.9% |
| Jamaicans | 2.5 /100 | #246 | Tragic 26.9% |
| Potawatomi | 2.2 /100 | #247 | Tragic 26.9% |
| Immigrants | Kazakhstan | 2.2 /100 | #248 | Tragic 26.9% |
| Immigrants | Eastern Europe | 2.1 /100 | #249 | Tragic 26.9% |
| Belgians | 2.1 /100 | #250 | Tragic 26.9% |
| Immigrants | Bosnia and Herzegovina | 1.9 /100 | #251 | Tragic 26.8% |
| Irish | 1.8 /100 | #252 | Tragic 26.8% |
| Italians | 1.5 /100 | #253 | Tragic 26.8% |