Immigrants from Chile vs Seminole Divorced or Separated
COMPARE
Immigrants from Chile
Seminole
Divorced or Separated
Divorced or Separated Comparison
Immigrants from Chile
Seminole
12.1%
DIVORCED OR SEPARATED
39.0/ 100
METRIC RATING
186th/ 347
METRIC RANK
14.3%
DIVORCED OR SEPARATED
0.0/ 100
METRIC RATING
342nd/ 347
METRIC RANK
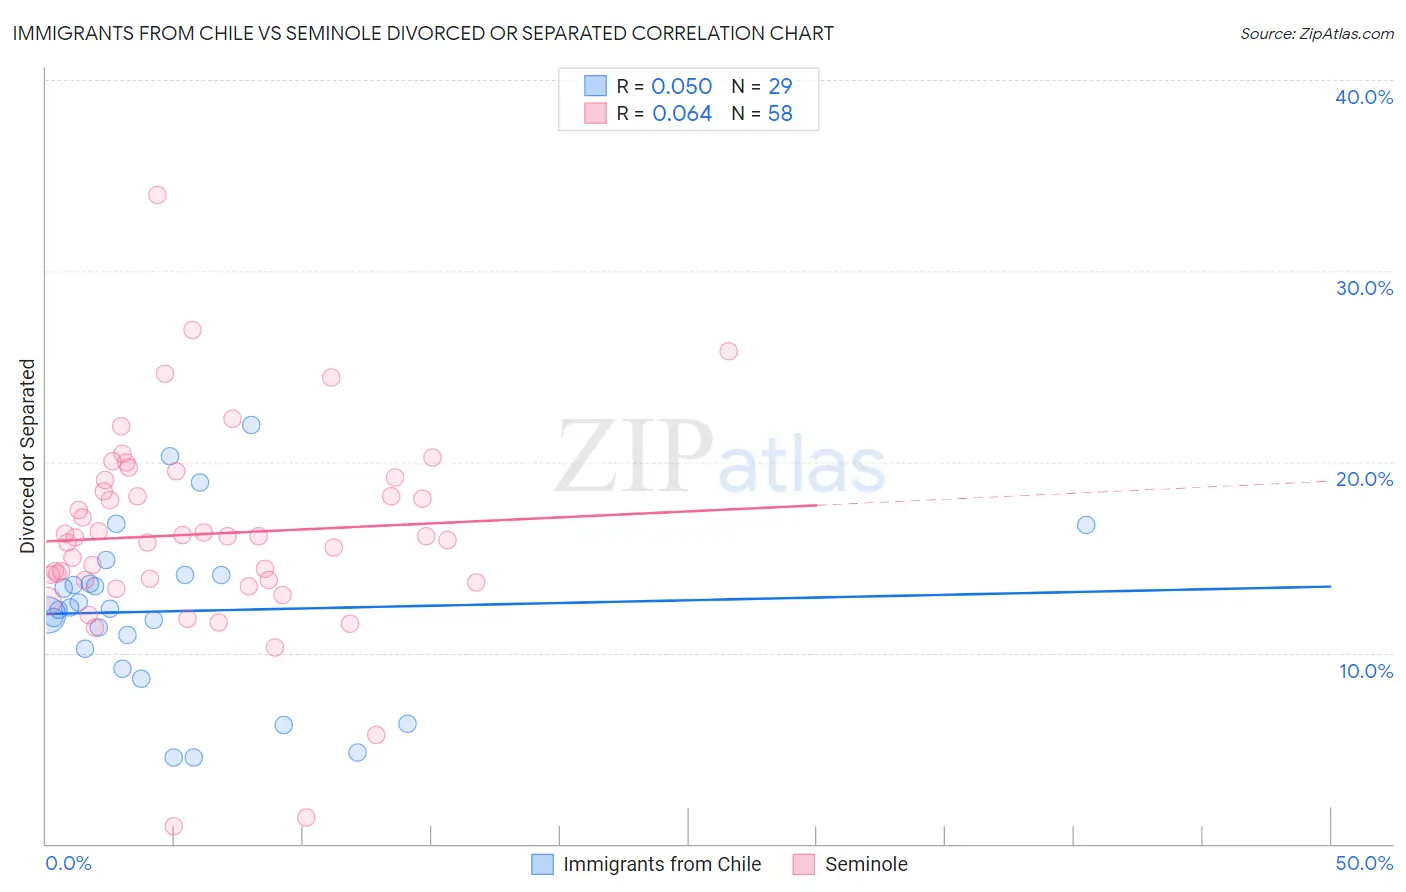
Immigrants from Chile vs Seminole Divorced or Separated Correlation Chart
The statistical analysis conducted on geographies consisting of 218,625,132 people shows no correlation between the proportion of Immigrants from Chile and percentage of population currently divorced or separated in the United States with a correlation coefficient (R) of 0.050 and weighted average of 12.1%. Similarly, the statistical analysis conducted on geographies consisting of 118,302,792 people shows a slight positive correlation between the proportion of Seminole and percentage of population currently divorced or separated in the United States with a correlation coefficient (R) of 0.064 and weighted average of 14.3%, a difference of 17.8%.
Divorced or Separated Correlation Summary
| Measurement | Immigrants from Chile | Seminole |
| Minimum | 4.5% | 0.90% |
| Maximum | 21.9% | 34.0% |
| Range | 17.4% | 33.1% |
| Mean | 12.2% | 16.2% |
| Median | 12.3% | 16.1% |
| Interquartile 25% (IQ1) | 9.7% | 13.8% |
| Interquartile 75% (IQ3) | 14.1% | 19.0% |
| Interquartile Range (IQR) | 4.4% | 5.2% |
| Standard Deviation (Sample) | 4.4% | 5.4% |
| Standard Deviation (Population) | 4.3% | 5.3% |
Similar Demographics by Divorced or Separated
Demographics Similar to Immigrants from Chile by Divorced or Separated
In terms of divorced or separated, the demographic groups most similar to Immigrants from Chile are Immigrants from Nigeria (12.1%, a difference of 0.050%), Belizean (12.1%, a difference of 0.050%), Immigrants from Belize (12.1%, a difference of 0.050%), Immigrants from North America (12.1%, a difference of 0.070%), and Sierra Leonean (12.1%, a difference of 0.13%).
| Demographics | Rating | Rank | Divorced or Separated |
| Immigrants | Western Europe | 45.6 /100 | #179 | Average 12.1% |
| Barbadians | 45.0 /100 | #180 | Average 12.1% |
| Immigrants | Canada | 44.0 /100 | #181 | Average 12.1% |
| Immigrants | Ethiopia | 43.1 /100 | #182 | Average 12.1% |
| Immigrants | Central America | 42.9 /100 | #183 | Average 12.1% |
| Immigrants | North America | 41.1 /100 | #184 | Average 12.1% |
| Immigrants | Nigeria | 40.5 /100 | #185 | Average 12.1% |
| Immigrants | Chile | 39.0 /100 | #186 | Fair 12.1% |
| Belizeans | 37.7 /100 | #187 | Fair 12.1% |
| Immigrants | Belize | 37.6 /100 | #188 | Fair 12.1% |
| Sierra Leoneans | 35.5 /100 | #189 | Fair 12.1% |
| Moroccans | 34.8 /100 | #190 | Fair 12.1% |
| Swedes | 34.4 /100 | #191 | Fair 12.1% |
| Norwegians | 33.2 /100 | #192 | Fair 12.1% |
| Immigrants | Thailand | 32.5 /100 | #193 | Fair 12.1% |
Demographics Similar to Seminole by Divorced or Separated
In terms of divorced or separated, the demographic groups most similar to Seminole are Bahamian (14.2%, a difference of 0.17%), Chickasaw (14.2%, a difference of 0.36%), Colville (14.2%, a difference of 0.40%), Choctaw (14.1%, a difference of 0.93%), and Creek (14.4%, a difference of 1.1%).
| Demographics | Rating | Rank | Divorced or Separated |
| Puerto Ricans | 0.0 /100 | #333 | Tragic 13.9% |
| Immigrants | Bahamas | 0.0 /100 | #334 | Tragic 13.9% |
| Dutch West Indians | 0.0 /100 | #335 | Tragic 14.0% |
| Shoshone | 0.0 /100 | #336 | Tragic 14.0% |
| Crow | 0.0 /100 | #337 | Tragic 14.1% |
| Choctaw | 0.0 /100 | #338 | Tragic 14.1% |
| Colville | 0.0 /100 | #339 | Tragic 14.2% |
| Chickasaw | 0.0 /100 | #340 | Tragic 14.2% |
| Bahamians | 0.0 /100 | #341 | Tragic 14.2% |
| Seminole | 0.0 /100 | #342 | Tragic 14.3% |
| Creek | 0.0 /100 | #343 | Tragic 14.4% |
| Cubans | 0.0 /100 | #344 | Tragic 14.5% |
| Kiowa | 0.0 /100 | #345 | Tragic 14.5% |
| Arapaho | 0.0 /100 | #346 | Tragic 14.8% |
| Immigrants | Cuba | 0.0 /100 | #347 | Tragic 15.2% |