Slovak vs Armenian Births to Unmarried Women
COMPARE
Slovak
Armenian
Births to Unmarried Women
Births to Unmarried Women Comparison
Slovaks
Armenians
33.4%
BIRTHS TO UNMARRIED WOMEN
9.3/ 100
METRIC RATING
214th/ 347
METRIC RANK
26.2%
BIRTHS TO UNMARRIED WOMEN
99.9/ 100
METRIC RATING
19th/ 347
METRIC RANK
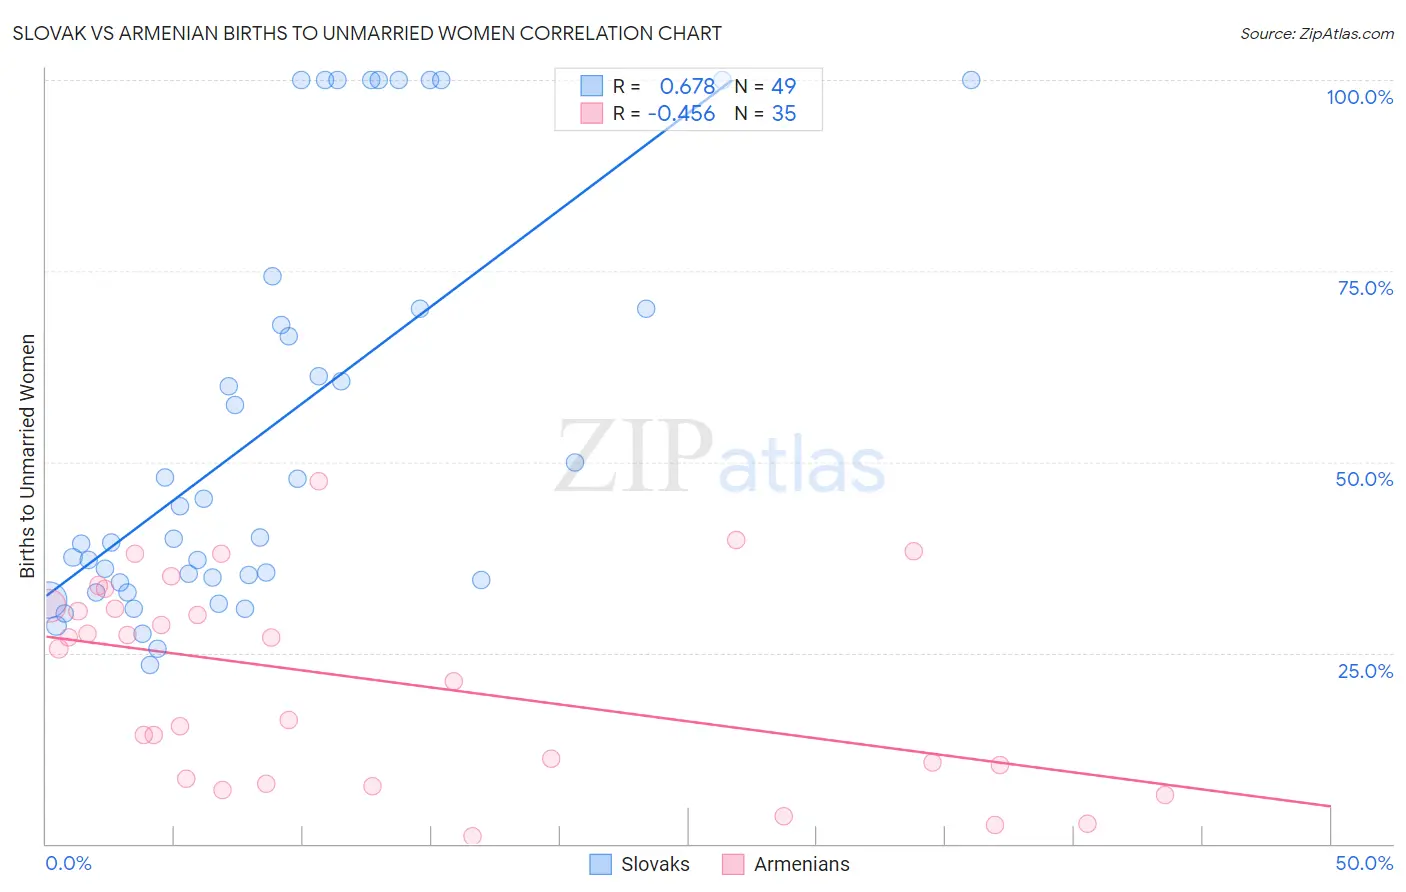
Slovak vs Armenian Births to Unmarried Women Correlation Chart
The statistical analysis conducted on geographies consisting of 364,615,569 people shows a significant positive correlation between the proportion of Slovaks and percentage of births to unmarried women in the United States with a correlation coefficient (R) of 0.678 and weighted average of 33.4%. Similarly, the statistical analysis conducted on geographies consisting of 289,699,675 people shows a moderate negative correlation between the proportion of Armenians and percentage of births to unmarried women in the United States with a correlation coefficient (R) of -0.456 and weighted average of 26.2%, a difference of 27.3%.
Births to Unmarried Women Correlation Summary
| Measurement | Slovak | Armenian |
| Minimum | 23.4% | 1.0% |
| Maximum | 100.0% | 47.5% |
| Range | 76.6% | 46.5% |
| Mean | 54.4% | 21.4% |
| Median | 40.0% | 25.5% |
| Interquartile 25% (IQ1) | 34.4% | 8.5% |
| Interquartile 75% (IQ3) | 70.0% | 31.1% |
| Interquartile Range (IQR) | 35.6% | 22.6% |
| Standard Deviation (Sample) | 26.5% | 13.1% |
| Standard Deviation (Population) | 26.2% | 12.9% |
Similar Demographics by Births to Unmarried Women
Demographics Similar to Slovaks by Births to Unmarried Women
In terms of births to unmarried women, the demographic groups most similar to Slovaks are Immigrants from Costa Rica (33.4%, a difference of 0.050%), French (33.4%, a difference of 0.18%), Celtic (33.3%, a difference of 0.24%), Ecuadorian (33.3%, a difference of 0.30%), and White/Caucasian (33.3%, a difference of 0.35%).
| Demographics | Rating | Rank | Births to Unmarried Women |
| Immigrants | Sudan | 11.5 /100 | #207 | Poor 33.2% |
| Hawaiians | 11.3 /100 | #208 | Poor 33.2% |
| Whites/Caucasians | 10.7 /100 | #209 | Poor 33.3% |
| Scotch-Irish | 10.7 /100 | #210 | Poor 33.3% |
| Ecuadorians | 10.5 /100 | #211 | Poor 33.3% |
| Celtics | 10.2 /100 | #212 | Poor 33.3% |
| Immigrants | Costa Rica | 9.5 /100 | #213 | Tragic 33.4% |
| Slovaks | 9.3 /100 | #214 | Tragic 33.4% |
| French | 8.7 /100 | #215 | Tragic 33.4% |
| Nepalese | 7.8 /100 | #216 | Tragic 33.5% |
| Spaniards | 7.0 /100 | #217 | Tragic 33.6% |
| Immigrants | Ecuador | 5.9 /100 | #218 | Tragic 33.7% |
| Alsatians | 5.4 /100 | #219 | Tragic 33.8% |
| Portuguese | 5.4 /100 | #220 | Tragic 33.8% |
| Malaysians | 5.0 /100 | #221 | Tragic 33.9% |
Demographics Similar to Armenians by Births to Unmarried Women
In terms of births to unmarried women, the demographic groups most similar to Armenians are Immigrants from Korea (26.3%, a difference of 0.21%), Soviet Union (26.3%, a difference of 0.35%), Burmese (26.4%, a difference of 0.57%), Immigrants from Armenia (26.1%, a difference of 0.58%), and Immigrants from Japan (26.4%, a difference of 0.76%).
| Demographics | Rating | Rank | Births to Unmarried Women |
| Indians (Asian) | 100.0 /100 | #12 | Exceptional 25.3% |
| Iranians | 100.0 /100 | #13 | Exceptional 25.3% |
| Immigrants | Lebanon | 100.0 /100 | #14 | Exceptional 25.3% |
| Immigrants | Singapore | 100.0 /100 | #15 | Exceptional 25.6% |
| Immigrants | Belarus | 100.0 /100 | #16 | Exceptional 25.6% |
| Immigrants | Uzbekistan | 100.0 /100 | #17 | Exceptional 25.8% |
| Immigrants | Armenia | 99.9 /100 | #18 | Exceptional 26.1% |
| Armenians | 99.9 /100 | #19 | Exceptional 26.2% |
| Immigrants | Korea | 99.9 /100 | #20 | Exceptional 26.3% |
| Soviet Union | 99.9 /100 | #21 | Exceptional 26.3% |
| Burmese | 99.9 /100 | #22 | Exceptional 26.4% |
| Immigrants | Japan | 99.9 /100 | #23 | Exceptional 26.4% |
| Immigrants | Australia | 99.9 /100 | #24 | Exceptional 26.6% |
| Cambodians | 99.9 /100 | #25 | Exceptional 26.7% |
| Asians | 99.9 /100 | #26 | Exceptional 26.8% |