Austrian vs Northern European Family Households with Children
COMPARE
Austrian
Northern European
Family Households with Children
Family Households with Children Comparison
Austrians
Northern Europeans
27.1%
FAMILY HOUSEHOLDS WITH CHILDREN
9.9/ 100
METRIC RATING
220th/ 347
METRIC RANK
27.2%
FAMILY HOUSEHOLDS WITH CHILDREN
12.8/ 100
METRIC RATING
215th/ 347
METRIC RANK
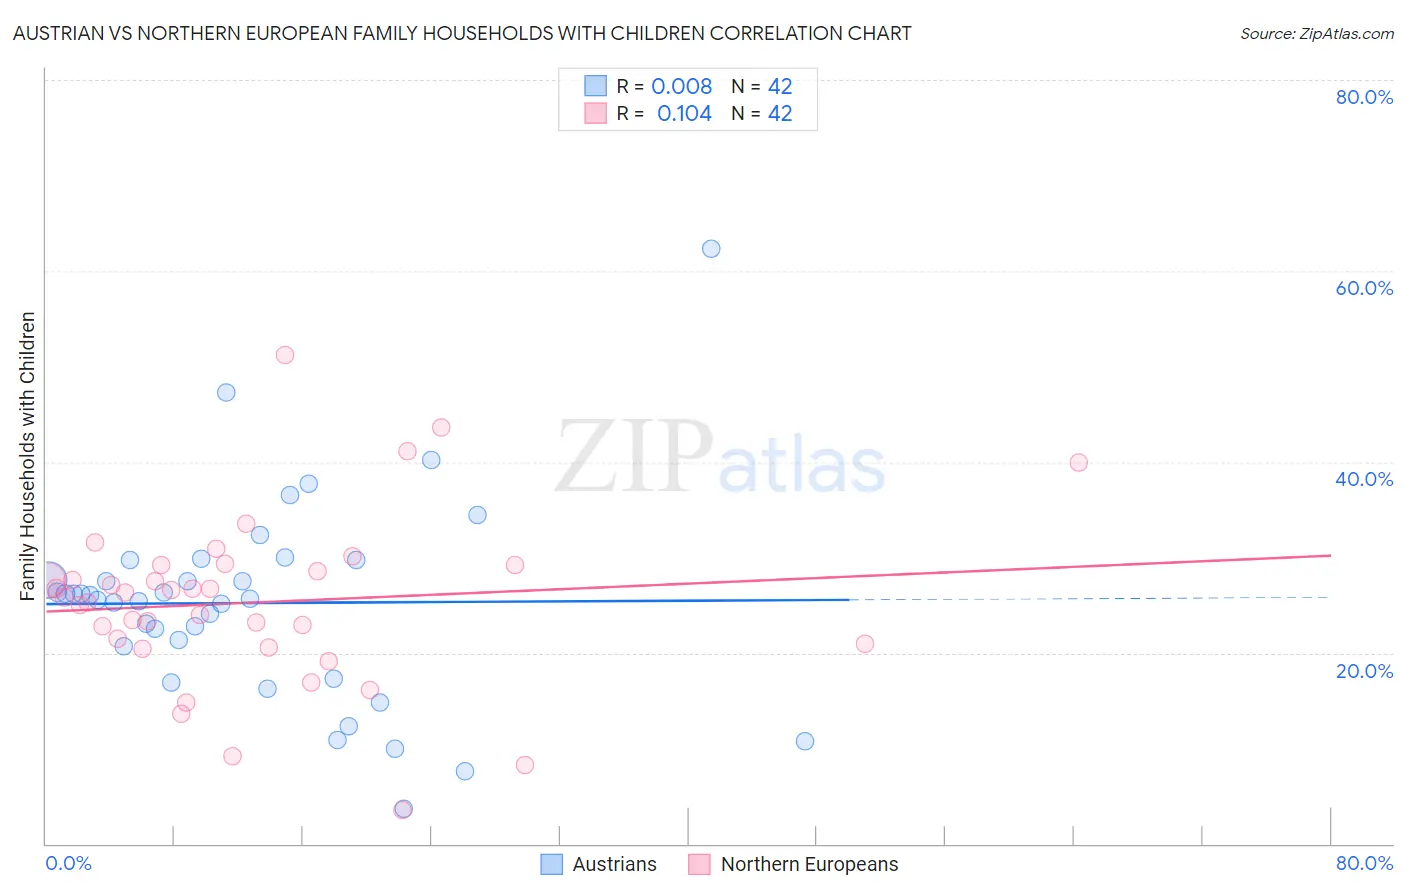
Austrian vs Northern European Family Households with Children Correlation Chart
The statistical analysis conducted on geographies consisting of 451,563,226 people shows no correlation between the proportion of Austrians and percentage of family households with children in the United States with a correlation coefficient (R) of 0.008 and weighted average of 27.1%. Similarly, the statistical analysis conducted on geographies consisting of 405,770,023 people shows a poor positive correlation between the proportion of Northern Europeans and percentage of family households with children in the United States with a correlation coefficient (R) of 0.104 and weighted average of 27.2%, a difference of 0.16%.
Family Households with Children Correlation Summary
| Measurement | Austrian | Northern European |
| Minimum | 3.6% | 3.5% |
| Maximum | 62.3% | 51.2% |
| Range | 58.6% | 47.7% |
| Mean | 25.2% | 25.3% |
| Median | 25.9% | 26.1% |
| Interquartile 25% (IQ1) | 20.7% | 20.9% |
| Interquartile 75% (IQ3) | 29.7% | 29.2% |
| Interquartile Range (IQR) | 9.1% | 8.3% |
| Standard Deviation (Sample) | 10.6% | 9.0% |
| Standard Deviation (Population) | 10.4% | 8.8% |
Demographics Similar to Austrians and Northern Europeans by Family Households with Children
In terms of family households with children, the demographic groups most similar to Austrians are New Zealander (27.1%, a difference of 0.020%), Paraguayan (27.1%, a difference of 0.030%), Immigrants from Japan (27.1%, a difference of 0.050%), Pima (27.1%, a difference of 0.050%), and German (27.1%, a difference of 0.080%). Similarly, the demographic groups most similar to Northern Europeans are African (27.2%, a difference of 0.010%), Cuban (27.1%, a difference of 0.030%), U.S. Virgin Islander (27.1%, a difference of 0.030%), Okinawan (27.2%, a difference of 0.040%), and Immigrants from Dominica (27.2%, a difference of 0.050%).
| Demographics | Rating | Rank | Family Households with Children |
| Haitians | 19.8 /100 | #207 | Poor 27.2% |
| Immigrants | Poland | 16.4 /100 | #208 | Poor 27.2% |
| Dutch West Indians | 15.8 /100 | #209 | Poor 27.2% |
| Immigrants | Ukraine | 14.4 /100 | #210 | Poor 27.2% |
| Welsh | 14.2 /100 | #211 | Poor 27.2% |
| Immigrants | Dominica | 13.9 /100 | #212 | Poor 27.2% |
| Okinawans | 13.7 /100 | #213 | Poor 27.2% |
| Africans | 13.0 /100 | #214 | Poor 27.2% |
| Northern Europeans | 12.8 /100 | #215 | Poor 27.2% |
| Cubans | 12.2 /100 | #216 | Poor 27.1% |
| U.S. Virgin Islanders | 12.1 /100 | #217 | Poor 27.1% |
| Greeks | 11.4 /100 | #218 | Poor 27.1% |
| Immigrants | Japan | 10.7 /100 | #219 | Poor 27.1% |
| Austrians | 9.9 /100 | #220 | Tragic 27.1% |
| New Zealanders | 9.6 /100 | #221 | Tragic 27.1% |
| Paraguayans | 9.4 /100 | #222 | Tragic 27.1% |
| Pima | 9.2 /100 | #223 | Tragic 27.1% |
| Germans | 8.7 /100 | #224 | Tragic 27.1% |
| Canadians | 7.5 /100 | #225 | Tragic 27.1% |
| Czechoslovakians | 6.6 /100 | #226 | Tragic 27.0% |
| Tsimshian | 6.6 /100 | #227 | Tragic 27.0% |