Immigrants from Syria vs Northern European Family Households with Children
COMPARE
Immigrants from Syria
Northern European
Family Households with Children
Family Households with Children Comparison
Immigrants from Syria
Northern Europeans
28.4%
FAMILY HOUSEHOLDS WITH CHILDREN
99.8/ 100
METRIC RATING
85th/ 347
METRIC RANK
27.2%
FAMILY HOUSEHOLDS WITH CHILDREN
12.8/ 100
METRIC RATING
215th/ 347
METRIC RANK
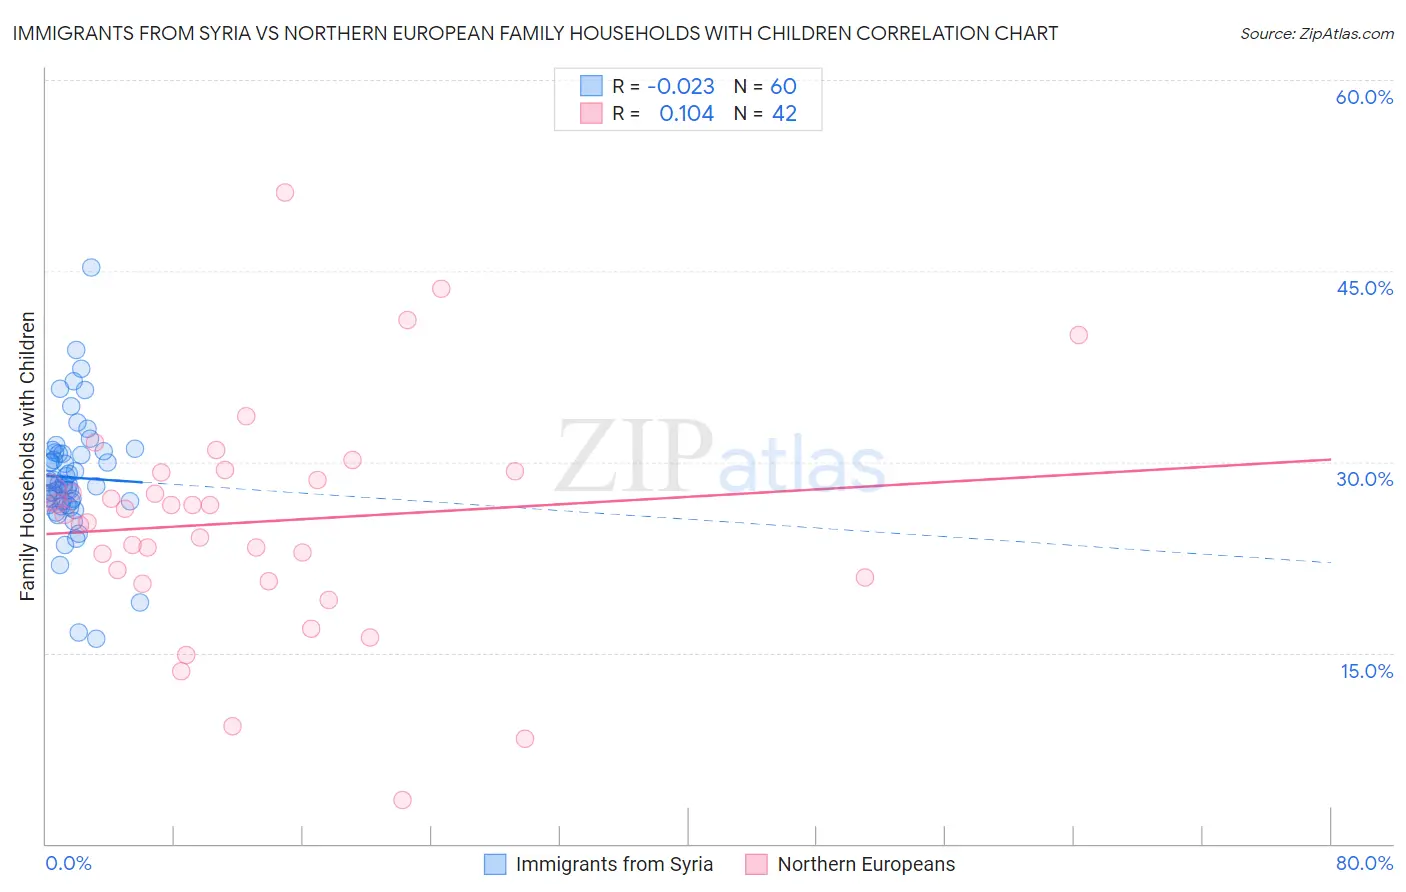
Immigrants from Syria vs Northern European Family Households with Children Correlation Chart
The statistical analysis conducted on geographies consisting of 174,092,818 people shows no correlation between the proportion of Immigrants from Syria and percentage of family households with children in the United States with a correlation coefficient (R) of -0.023 and weighted average of 28.4%. Similarly, the statistical analysis conducted on geographies consisting of 405,770,023 people shows a poor positive correlation between the proportion of Northern Europeans and percentage of family households with children in the United States with a correlation coefficient (R) of 0.104 and weighted average of 27.2%, a difference of 4.4%.
Family Households with Children Correlation Summary
| Measurement | Immigrants from Syria | Northern European |
| Minimum | 16.1% | 3.5% |
| Maximum | 45.3% | 51.2% |
| Range | 29.2% | 47.7% |
| Mean | 28.8% | 25.3% |
| Median | 28.3% | 26.1% |
| Interquartile 25% (IQ1) | 26.8% | 20.9% |
| Interquartile 75% (IQ3) | 30.7% | 29.2% |
| Interquartile Range (IQR) | 3.9% | 8.3% |
| Standard Deviation (Sample) | 4.7% | 9.0% |
| Standard Deviation (Population) | 4.7% | 8.8% |
Similar Demographics by Family Households with Children
Demographics Similar to Immigrants from Syria by Family Households with Children
In terms of family households with children, the demographic groups most similar to Immigrants from Syria are Nicaraguan (28.4%, a difference of 0.020%), Costa Rican (28.4%, a difference of 0.020%), Kenyan (28.4%, a difference of 0.070%), South American (28.4%, a difference of 0.11%), and Native/Alaskan (28.4%, a difference of 0.14%).
| Demographics | Rating | Rank | Family Households with Children |
| Immigrants | Nepal | 99.8 /100 | #78 | Exceptional 28.4% |
| Immigrants | Iraq | 99.8 /100 | #79 | Exceptional 28.4% |
| Natives/Alaskans | 99.8 /100 | #80 | Exceptional 28.4% |
| South Americans | 99.8 /100 | #81 | Exceptional 28.4% |
| Kenyans | 99.8 /100 | #82 | Exceptional 28.4% |
| Nicaraguans | 99.8 /100 | #83 | Exceptional 28.4% |
| Costa Ricans | 99.8 /100 | #84 | Exceptional 28.4% |
| Immigrants | Syria | 99.8 /100 | #85 | Exceptional 28.4% |
| Immigrants | Western Africa | 99.6 /100 | #86 | Exceptional 28.3% |
| Colombians | 99.6 /100 | #87 | Exceptional 28.3% |
| Liberians | 99.6 /100 | #88 | Exceptional 28.3% |
| Immigrants | Costa Rica | 99.6 /100 | #89 | Exceptional 28.3% |
| Immigrants | Thailand | 99.5 /100 | #90 | Exceptional 28.2% |
| Immigrants | Liberia | 99.4 /100 | #91 | Exceptional 28.2% |
| Chickasaw | 99.4 /100 | #92 | Exceptional 28.2% |
Demographics Similar to Northern Europeans by Family Households with Children
In terms of family households with children, the demographic groups most similar to Northern Europeans are African (27.2%, a difference of 0.010%), Cuban (27.1%, a difference of 0.030%), U.S. Virgin Islander (27.1%, a difference of 0.030%), Okinawan (27.2%, a difference of 0.040%), and Immigrants from Dominica (27.2%, a difference of 0.050%).
| Demographics | Rating | Rank | Family Households with Children |
| Immigrants | Poland | 16.4 /100 | #208 | Poor 27.2% |
| Dutch West Indians | 15.8 /100 | #209 | Poor 27.2% |
| Immigrants | Ukraine | 14.4 /100 | #210 | Poor 27.2% |
| Welsh | 14.2 /100 | #211 | Poor 27.2% |
| Immigrants | Dominica | 13.9 /100 | #212 | Poor 27.2% |
| Okinawans | 13.7 /100 | #213 | Poor 27.2% |
| Africans | 13.0 /100 | #214 | Poor 27.2% |
| Northern Europeans | 12.8 /100 | #215 | Poor 27.2% |
| Cubans | 12.2 /100 | #216 | Poor 27.1% |
| U.S. Virgin Islanders | 12.1 /100 | #217 | Poor 27.1% |
| Greeks | 11.4 /100 | #218 | Poor 27.1% |
| Immigrants | Japan | 10.7 /100 | #219 | Poor 27.1% |
| Austrians | 9.9 /100 | #220 | Tragic 27.1% |
| New Zealanders | 9.6 /100 | #221 | Tragic 27.1% |
| Paraguayans | 9.4 /100 | #222 | Tragic 27.1% |