Scottish vs Immigrants from Argentina Births to Unmarried Women
COMPARE
Scottish
Immigrants from Argentina
Births to Unmarried Women
Births to Unmarried Women Comparison
Scottish
Immigrants from Argentina
31.7%
BIRTHS TO UNMARRIED WOMEN
48.1/ 100
METRIC RATING
176th/ 347
METRIC RANK
30.1%
BIRTHS TO UNMARRIED WOMEN
88.7/ 100
METRIC RATING
122nd/ 347
METRIC RANK
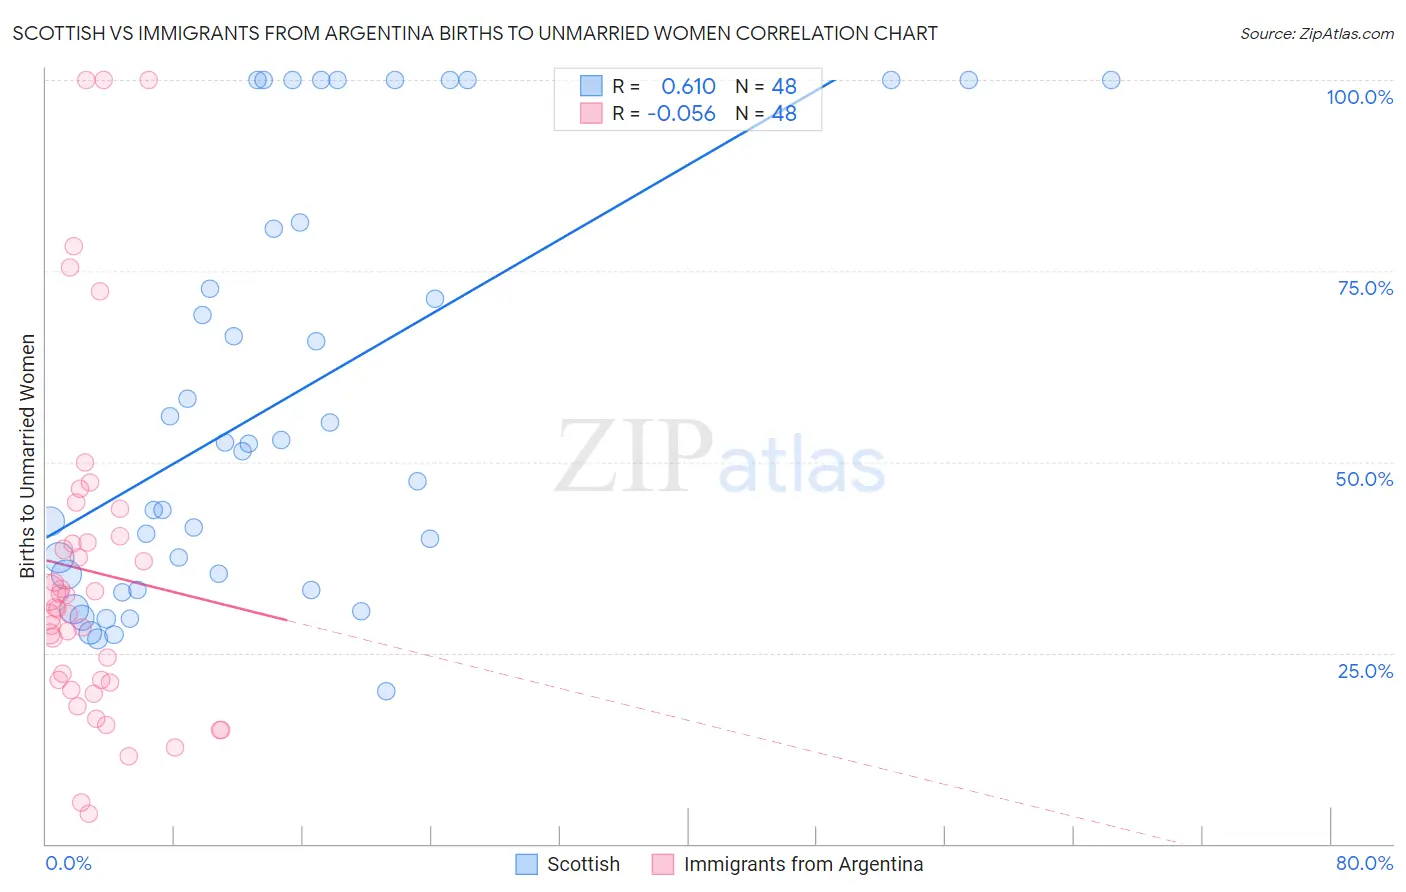
Scottish vs Immigrants from Argentina Births to Unmarried Women Correlation Chart
The statistical analysis conducted on geographies consisting of 501,775,735 people shows a significant positive correlation between the proportion of Scottish and percentage of births to unmarried women in the United States with a correlation coefficient (R) of 0.610 and weighted average of 31.7%. Similarly, the statistical analysis conducted on geographies consisting of 249,724,782 people shows a slight negative correlation between the proportion of Immigrants from Argentina and percentage of births to unmarried women in the United States with a correlation coefficient (R) of -0.056 and weighted average of 30.1%, a difference of 5.3%.
Births to Unmarried Women Correlation Summary
| Measurement | Scottish | Immigrants from Argentina |
| Minimum | 20.0% | 4.0% |
| Maximum | 100.0% | 100.0% |
| Range | 80.0% | 96.0% |
| Mean | 58.0% | 35.7% |
| Median | 51.9% | 30.9% |
| Interquartile 25% (IQ1) | 34.3% | 21.2% |
| Interquartile 75% (IQ3) | 80.9% | 39.8% |
| Interquartile Range (IQR) | 46.7% | 18.5% |
| Standard Deviation (Sample) | 27.2% | 22.9% |
| Standard Deviation (Population) | 26.9% | 22.7% |
Similar Demographics by Births to Unmarried Women
Demographics Similar to Scottish by Births to Unmarried Women
In terms of births to unmarried women, the demographic groups most similar to Scottish are South American Indian (31.7%, a difference of 0.040%), English (31.7%, a difference of 0.070%), Immigrants from Venezuela (31.7%, a difference of 0.10%), South American (31.8%, a difference of 0.11%), and Venezuelan (31.7%, a difference of 0.18%).
| Demographics | Rating | Rank | Births to Unmarried Women |
| Slavs | 52.0 /100 | #169 | Average 31.6% |
| Guamanians/Chamorros | 51.3 /100 | #170 | Average 31.6% |
| Finns | 50.5 /100 | #171 | Average 31.7% |
| Immigrants | Eritrea | 50.4 /100 | #172 | Average 31.7% |
| Immigrants | Yemen | 50.2 /100 | #173 | Average 31.7% |
| Venezuelans | 50.0 /100 | #174 | Average 31.7% |
| Immigrants | Venezuela | 49.2 /100 | #175 | Average 31.7% |
| Scottish | 48.1 /100 | #176 | Average 31.7% |
| South American Indians | 47.7 /100 | #177 | Average 31.7% |
| English | 47.4 /100 | #178 | Average 31.7% |
| South Americans | 46.9 /100 | #179 | Average 31.8% |
| Moroccans | 45.7 /100 | #180 | Average 31.8% |
| Immigrants | Peru | 45.1 /100 | #181 | Average 31.8% |
| Kenyans | 43.0 /100 | #182 | Average 31.9% |
| Canadians | 41.4 /100 | #183 | Average 31.9% |
Demographics Similar to Immigrants from Argentina by Births to Unmarried Women
In terms of births to unmarried women, the demographic groups most similar to Immigrants from Argentina are Korean (30.1%, a difference of 0.050%), Ugandan (30.1%, a difference of 0.12%), Syrian (30.2%, a difference of 0.13%), Croatian (30.2%, a difference of 0.17%), and Vietnamese (30.2%, a difference of 0.24%).
| Demographics | Rating | Rank | Births to Unmarried Women |
| Ethiopians | 91.9 /100 | #115 | Exceptional 29.8% |
| Immigrants | Italy | 91.7 /100 | #116 | Exceptional 29.9% |
| Immigrants | Netherlands | 91.1 /100 | #117 | Exceptional 29.9% |
| Immigrants | Norway | 91.0 /100 | #118 | Exceptional 29.9% |
| Argentineans | 90.5 /100 | #119 | Exceptional 30.0% |
| Ugandans | 89.2 /100 | #120 | Excellent 30.1% |
| Koreans | 88.9 /100 | #121 | Excellent 30.1% |
| Immigrants | Argentina | 88.7 /100 | #122 | Excellent 30.1% |
| Syrians | 88.2 /100 | #123 | Excellent 30.2% |
| Croatians | 88.0 /100 | #124 | Excellent 30.2% |
| Vietnamese | 87.7 /100 | #125 | Excellent 30.2% |
| Europeans | 87.2 /100 | #126 | Excellent 30.2% |
| Chinese | 87.1 /100 | #127 | Excellent 30.2% |
| Icelanders | 86.0 /100 | #128 | Excellent 30.3% |
| Immigrants | Spain | 85.8 /100 | #129 | Excellent 30.3% |