Scotch-Irish vs Costa Rican Married-couple Households
COMPARE
Scotch-Irish
Costa Rican
Married-couple Households
Married-couple Households Comparison
Scotch-Irish
Costa Ricans
48.3%
MARRIED-COUPLE HOUSEHOLDS
98.6/ 100
METRIC RATING
72nd/ 347
METRIC RANK
47.2%
MARRIED-COUPLE HOUSEHOLDS
84.4/ 100
METRIC RATING
141st/ 347
METRIC RANK
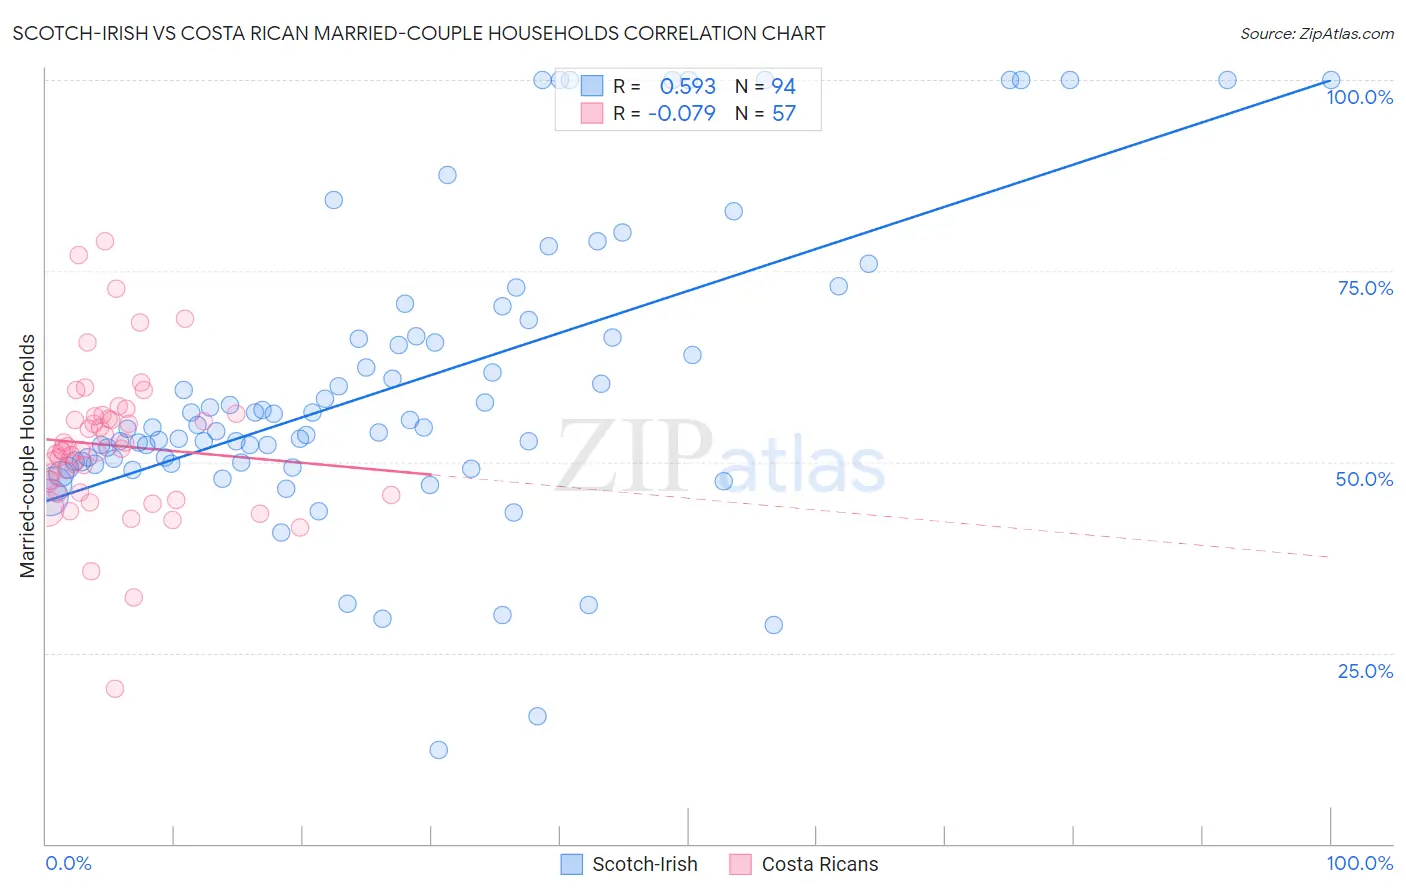
Scotch-Irish vs Costa Rican Married-couple Households Correlation Chart
The statistical analysis conducted on geographies consisting of 548,347,106 people shows a substantial positive correlation between the proportion of Scotch-Irish and percentage of married-couple family households in the United States with a correlation coefficient (R) of 0.593 and weighted average of 48.3%. Similarly, the statistical analysis conducted on geographies consisting of 253,452,851 people shows a slight negative correlation between the proportion of Costa Ricans and percentage of married-couple family households in the United States with a correlation coefficient (R) of -0.079 and weighted average of 47.2%, a difference of 2.4%.
Married-couple Households Correlation Summary
| Measurement | Scotch-Irish | Costa Rican |
| Minimum | 12.2% | 20.3% |
| Maximum | 100.0% | 78.9% |
| Range | 87.8% | 58.6% |
| Mean | 60.1% | 52.2% |
| Median | 54.5% | 51.6% |
| Interquartile 25% (IQ1) | 49.9% | 45.9% |
| Interquartile 75% (IQ3) | 66.4% | 56.0% |
| Interquartile Range (IQR) | 16.6% | 10.1% |
| Standard Deviation (Sample) | 19.3% | 9.9% |
| Standard Deviation (Population) | 19.2% | 9.8% |
Similar Demographics by Married-couple Households
Demographics Similar to Scotch-Irish by Married-couple Households
In terms of married-couple households, the demographic groups most similar to Scotch-Irish are Immigrants from Singapore (48.3%, a difference of 0.020%), Immigrants from Romania (48.3%, a difference of 0.040%), Immigrants from England (48.2%, a difference of 0.12%), Immigrants from Fiji (48.2%, a difference of 0.13%), and Laotian (48.4%, a difference of 0.17%).
| Demographics | Rating | Rank | Married-couple Households |
| Immigrants | Canada | 99.0 /100 | #65 | Exceptional 48.4% |
| Jordanians | 98.9 /100 | #66 | Exceptional 48.4% |
| Romanians | 98.9 /100 | #67 | Exceptional 48.4% |
| Immigrants | South Eastern Asia | 98.9 /100 | #68 | Exceptional 48.4% |
| Immigrants | China | 98.9 /100 | #69 | Exceptional 48.4% |
| Immigrants | North America | 98.9 /100 | #70 | Exceptional 48.4% |
| Laotians | 98.8 /100 | #71 | Exceptional 48.4% |
| Scotch-Irish | 98.6 /100 | #72 | Exceptional 48.3% |
| Immigrants | Singapore | 98.6 /100 | #73 | Exceptional 48.3% |
| Immigrants | Romania | 98.6 /100 | #74 | Exceptional 48.3% |
| Immigrants | England | 98.4 /100 | #75 | Exceptional 48.2% |
| Immigrants | Fiji | 98.4 /100 | #76 | Exceptional 48.2% |
| Canadians | 98.2 /100 | #77 | Exceptional 48.2% |
| Egyptians | 98.2 /100 | #78 | Exceptional 48.2% |
| Immigrants | Netherlands | 98.2 /100 | #79 | Exceptional 48.2% |
Demographics Similar to Costa Ricans by Married-couple Households
In terms of married-couple households, the demographic groups most similar to Costa Ricans are Spanish (47.2%, a difference of 0.0%), Immigrants from Sweden (47.2%, a difference of 0.020%), Spaniard (47.2%, a difference of 0.020%), Immigrants from Belarus (47.2%, a difference of 0.040%), and Immigrants from Afghanistan (47.2%, a difference of 0.050%).
| Demographics | Rating | Rank | Married-couple Households |
| Immigrants | Greece | 86.0 /100 | #134 | Excellent 47.2% |
| Immigrants | Argentina | 86.0 /100 | #135 | Excellent 47.2% |
| New Zealanders | 85.3 /100 | #136 | Excellent 47.2% |
| Immigrants | Malaysia | 85.2 /100 | #137 | Excellent 47.2% |
| Immigrants | Afghanistan | 85.1 /100 | #138 | Excellent 47.2% |
| Immigrants | Sweden | 84.7 /100 | #139 | Excellent 47.2% |
| Spanish | 84.5 /100 | #140 | Excellent 47.2% |
| Costa Ricans | 84.4 /100 | #141 | Excellent 47.2% |
| Spaniards | 84.1 /100 | #142 | Excellent 47.2% |
| Immigrants | Belarus | 83.8 /100 | #143 | Excellent 47.2% |
| Mexicans | 83.4 /100 | #144 | Excellent 47.1% |
| Slovenes | 81.7 /100 | #145 | Excellent 47.1% |
| Immigrants | Western Europe | 81.6 /100 | #146 | Excellent 47.1% |
| Immigrants | Syria | 81.6 /100 | #147 | Excellent 47.1% |
| Icelanders | 79.5 /100 | #148 | Good 47.0% |