Scandinavian vs Immigrants from India Family Households with Children
COMPARE
Scandinavian
Immigrants from India
Family Households with Children
Family Households with Children Comparison
Scandinavians
Immigrants from India
28.0%
FAMILY HOUSEHOLDS WITH CHILDREN
97.1/ 100
METRIC RATING
111th/ 347
METRIC RANK
31.0%
FAMILY HOUSEHOLDS WITH CHILDREN
100.0/ 100
METRIC RATING
6th/ 347
METRIC RANK
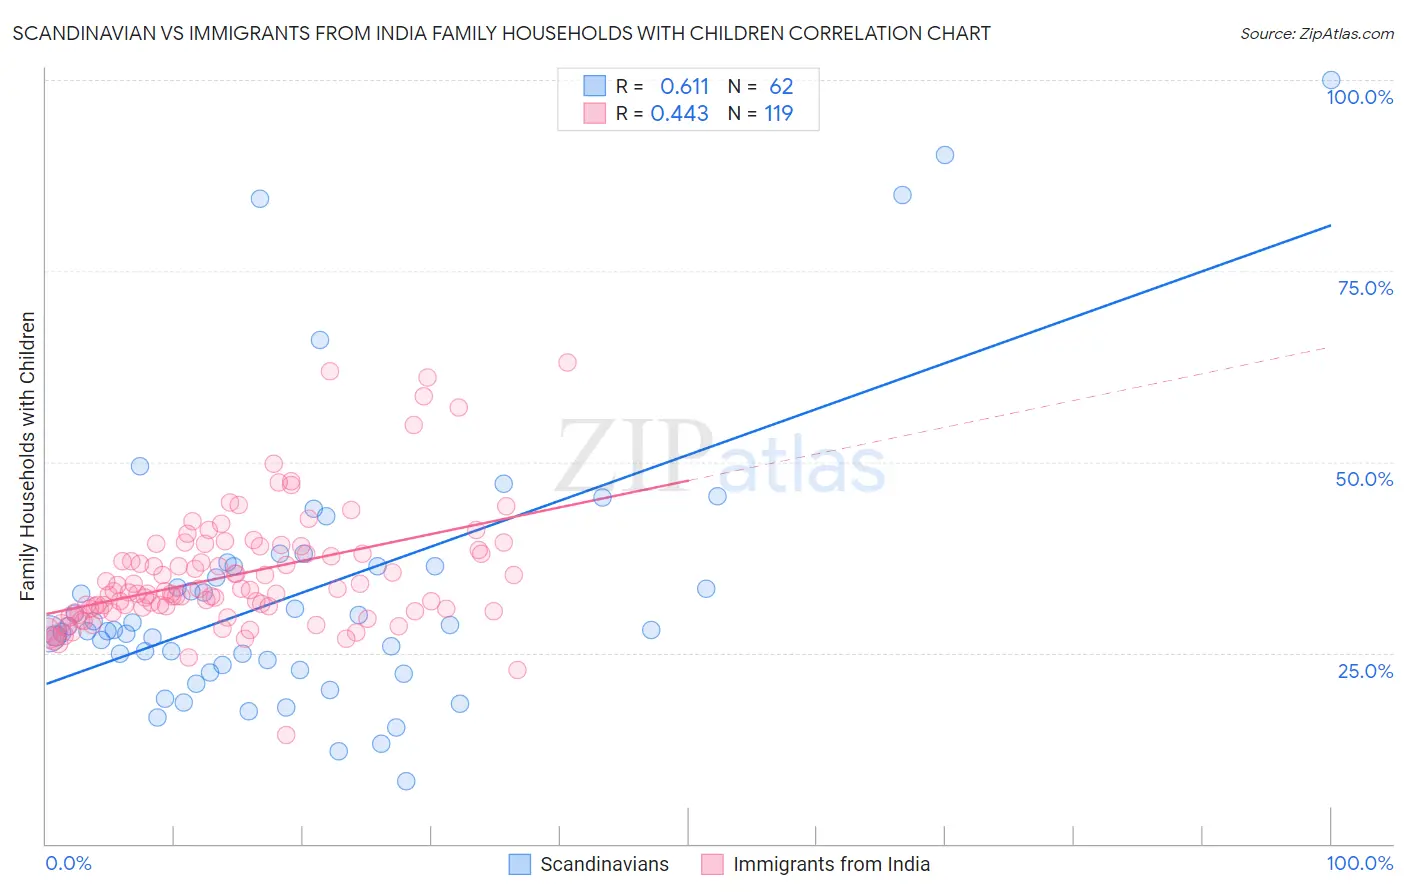
Scandinavian vs Immigrants from India Family Households with Children Correlation Chart
The statistical analysis conducted on geographies consisting of 472,042,007 people shows a significant positive correlation between the proportion of Scandinavians and percentage of family households with children in the United States with a correlation coefficient (R) of 0.611 and weighted average of 28.0%. Similarly, the statistical analysis conducted on geographies consisting of 433,596,675 people shows a moderate positive correlation between the proportion of Immigrants from India and percentage of family households with children in the United States with a correlation coefficient (R) of 0.443 and weighted average of 31.0%, a difference of 11.0%.
Family Households with Children Correlation Summary
| Measurement | Scandinavian | Immigrants from India |
| Minimum | 8.1% | 14.3% |
| Maximum | 100.0% | 63.0% |
| Range | 91.9% | 48.8% |
| Mean | 32.9% | 35.1% |
| Median | 28.0% | 32.8% |
| Interquartile 25% (IQ1) | 23.4% | 30.5% |
| Interquartile 75% (IQ3) | 36.4% | 38.4% |
| Interquartile Range (IQR) | 13.0% | 7.9% |
| Standard Deviation (Sample) | 18.1% | 7.9% |
| Standard Deviation (Population) | 17.9% | 7.9% |
Similar Demographics by Family Households with Children
Demographics Similar to Scandinavians by Family Households with Children
In terms of family households with children, the demographic groups most similar to Scandinavians are Immigrants from Middle Africa (28.0%, a difference of 0.030%), Arab (28.0%, a difference of 0.030%), South American Indian (28.0%, a difference of 0.050%), Spaniard (28.0%, a difference of 0.060%), and Immigrants from Africa (28.0%, a difference of 0.060%).
| Demographics | Rating | Rank | Family Households with Children |
| Sioux | 98.3 /100 | #104 | Exceptional 28.1% |
| Choctaw | 98.3 /100 | #105 | Exceptional 28.1% |
| Immigrants | South America | 98.0 /100 | #106 | Exceptional 28.0% |
| Immigrants | Uganda | 97.7 /100 | #107 | Exceptional 28.0% |
| Immigrants | Burma/Myanmar | 97.7 /100 | #108 | Exceptional 28.0% |
| Tohono O'odham | 97.6 /100 | #109 | Exceptional 28.0% |
| Spaniards | 97.4 /100 | #110 | Exceptional 28.0% |
| Scandinavians | 97.1 /100 | #111 | Exceptional 28.0% |
| Immigrants | Middle Africa | 97.0 /100 | #112 | Exceptional 28.0% |
| Arabs | 97.0 /100 | #113 | Exceptional 28.0% |
| South American Indians | 96.9 /100 | #114 | Exceptional 28.0% |
| Immigrants | Africa | 96.8 /100 | #115 | Exceptional 28.0% |
| Pakistanis | 96.0 /100 | #116 | Exceptional 27.9% |
| Immigrants | Malaysia | 95.9 /100 | #117 | Exceptional 27.9% |
| Central American Indians | 95.9 /100 | #118 | Exceptional 27.9% |
Demographics Similar to Immigrants from India by Family Households with Children
In terms of family households with children, the demographic groups most similar to Immigrants from India are Immigrants from Central America (31.0%, a difference of 0.29%), Tongan (31.2%, a difference of 0.62%), Yakama (30.8%, a difference of 0.87%), Mexican (31.4%, a difference of 1.0%), and Thai (30.6%, a difference of 1.3%).
| Demographics | Rating | Rank | Family Households with Children |
| Yup'ik | 100 /100 | #1 | Exceptional 37.0% |
| Inupiat | 100 /100 | #2 | Exceptional 32.8% |
| Immigrants | Mexico | 100.0 /100 | #3 | Exceptional 31.6% |
| Mexicans | 100.0 /100 | #4 | Exceptional 31.4% |
| Tongans | 100.0 /100 | #5 | Exceptional 31.2% |
| Immigrants | India | 100.0 /100 | #6 | Exceptional 31.0% |
| Immigrants | Central America | 100.0 /100 | #7 | Exceptional 31.0% |
| Yakama | 100.0 /100 | #8 | Exceptional 30.8% |
| Thais | 100.0 /100 | #9 | Exceptional 30.6% |
| Immigrants | Fiji | 100.0 /100 | #10 | Exceptional 30.5% |
| Nepalese | 100.0 /100 | #11 | Exceptional 30.5% |
| Immigrants | Pakistan | 100.0 /100 | #12 | Exceptional 30.2% |
| Afghans | 100.0 /100 | #13 | Exceptional 30.2% |
| Bangladeshis | 100.0 /100 | #14 | Exceptional 30.1% |
| Immigrants | South Central Asia | 100.0 /100 | #15 | Exceptional 30.0% |