Immigrants from Africa vs Maltese Single Father Households
COMPARE
Immigrants from Africa
Maltese
Single Father Households
Single Father Households Comparison
Immigrants from Africa
Maltese
2.4%
SINGLE FATHER HOUSEHOLDS
30.0/ 100
METRIC RATING
191st/ 347
METRIC RANK
2.0%
SINGLE FATHER HOUSEHOLDS
99.9/ 100
METRIC RATING
63rd/ 347
METRIC RANK
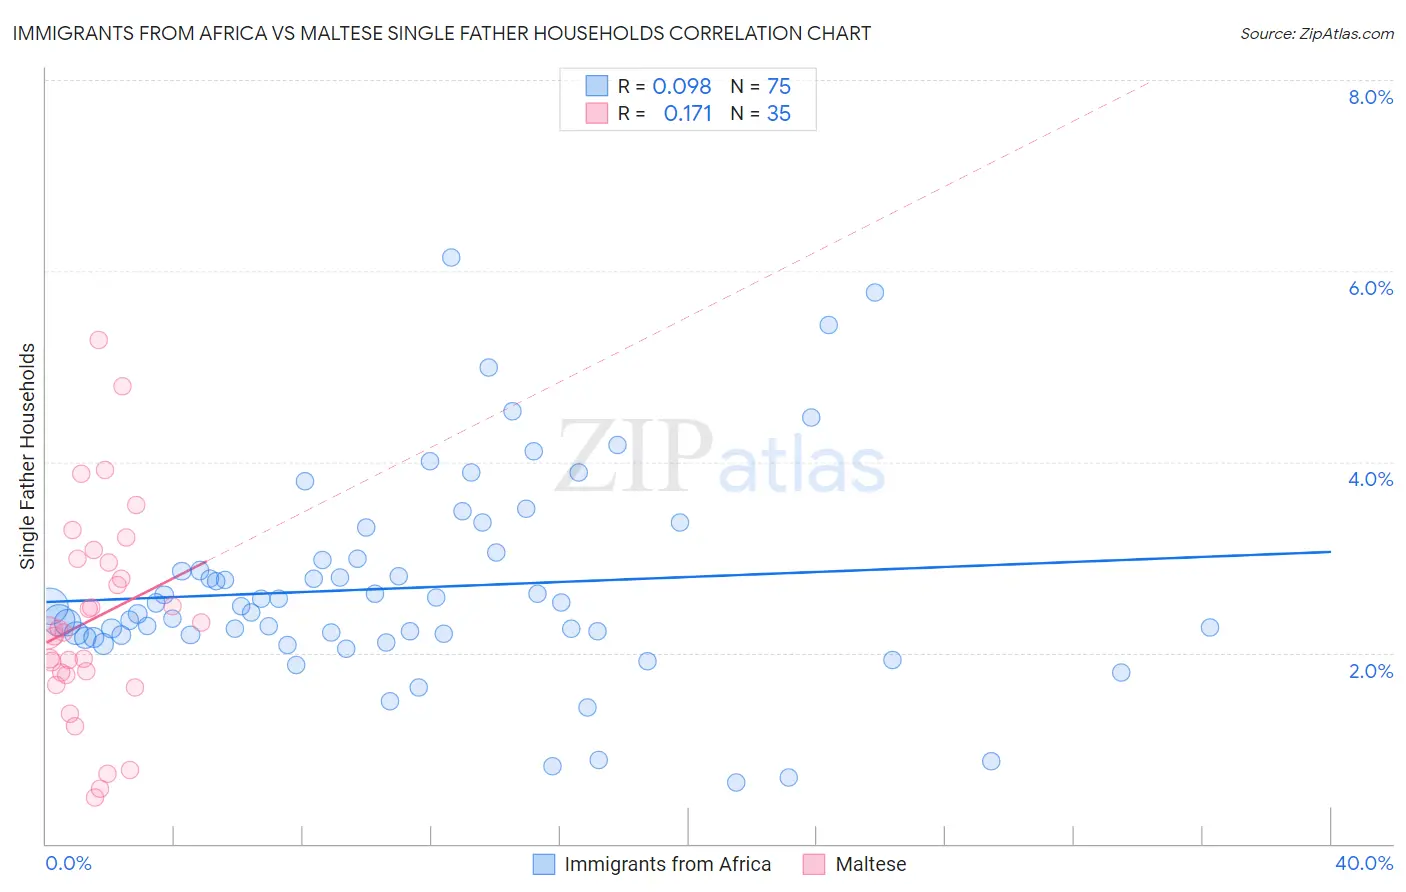
Immigrants from Africa vs Maltese Single Father Households Correlation Chart
The statistical analysis conducted on geographies consisting of 464,041,277 people shows a slight positive correlation between the proportion of Immigrants from Africa and percentage of single father households in the United States with a correlation coefficient (R) of 0.098 and weighted average of 2.4%. Similarly, the statistical analysis conducted on geographies consisting of 125,770,300 people shows a poor positive correlation between the proportion of Maltese and percentage of single father households in the United States with a correlation coefficient (R) of 0.171 and weighted average of 2.0%, a difference of 15.9%.
Single Father Households Correlation Summary
| Measurement | Immigrants from Africa | Maltese |
| Minimum | 0.64% | 0.48% |
| Maximum | 6.1% | 5.3% |
| Range | 5.5% | 4.8% |
| Mean | 2.7% | 2.4% |
| Median | 2.5% | 2.2% |
| Interquartile 25% (IQ1) | 2.2% | 1.8% |
| Interquartile 75% (IQ3) | 3.0% | 3.0% |
| Interquartile Range (IQR) | 0.81% | 1.2% |
| Standard Deviation (Sample) | 1.1% | 1.1% |
| Standard Deviation (Population) | 1.1% | 1.1% |
Similar Demographics by Single Father Households
Demographics Similar to Immigrants from Africa by Single Father Households
In terms of single father households, the demographic groups most similar to Immigrants from Africa are Immigrants from Sudan (2.4%, a difference of 0.010%), Uruguayan (2.4%, a difference of 0.030%), Panamanian (2.4%, a difference of 0.030%), Immigrants from Philippines (2.4%, a difference of 0.11%), and U.S. Virgin Islander (2.4%, a difference of 0.15%).
| Demographics | Rating | Rank | Single Father Households |
| Sri Lankans | 41.8 /100 | #184 | Average 2.4% |
| Nigerians | 41.0 /100 | #185 | Average 2.4% |
| Immigrants | Bosnia and Herzegovina | 40.4 /100 | #186 | Average 2.4% |
| Immigrants | Colombia | 34.0 /100 | #187 | Fair 2.4% |
| Hmong | 33.0 /100 | #188 | Fair 2.4% |
| U.S. Virgin Islanders | 31.8 /100 | #189 | Fair 2.4% |
| French | 31.7 /100 | #190 | Fair 2.4% |
| Immigrants | Africa | 30.0 /100 | #191 | Fair 2.4% |
| Immigrants | Sudan | 29.8 /100 | #192 | Fair 2.4% |
| Uruguayans | 29.7 /100 | #193 | Fair 2.4% |
| Panamanians | 29.6 /100 | #194 | Fair 2.4% |
| Immigrants | Philippines | 28.7 /100 | #195 | Fair 2.4% |
| Kenyans | 28.0 /100 | #196 | Fair 2.4% |
| Germans | 28.0 /100 | #197 | Fair 2.4% |
| Scandinavians | 27.4 /100 | #198 | Fair 2.4% |
Demographics Similar to Maltese by Single Father Households
In terms of single father households, the demographic groups most similar to Maltese are Mongolian (2.1%, a difference of 0.14%), Paraguayan (2.1%, a difference of 0.17%), Immigrants from Malaysia (2.0%, a difference of 0.20%), Vietnamese (2.0%, a difference of 0.39%), and Immigrants from Western Asia (2.1%, a difference of 0.53%).
| Demographics | Rating | Rank | Single Father Households |
| Immigrants | Norway | 99.9 /100 | #56 | Exceptional 2.0% |
| Burmese | 99.9 /100 | #57 | Exceptional 2.0% |
| Immigrants | Czechoslovakia | 99.9 /100 | #58 | Exceptional 2.0% |
| Immigrants | North Macedonia | 99.9 /100 | #59 | Exceptional 2.0% |
| Immigrants | Austria | 99.9 /100 | #60 | Exceptional 2.0% |
| Vietnamese | 99.9 /100 | #61 | Exceptional 2.0% |
| Immigrants | Malaysia | 99.9 /100 | #62 | Exceptional 2.0% |
| Maltese | 99.9 /100 | #63 | Exceptional 2.0% |
| Mongolians | 99.9 /100 | #64 | Exceptional 2.1% |
| Paraguayans | 99.9 /100 | #65 | Exceptional 2.1% |
| Immigrants | Western Asia | 99.8 /100 | #66 | Exceptional 2.1% |
| Immigrants | Italy | 99.8 /100 | #67 | Exceptional 2.1% |
| Immigrants | Denmark | 99.8 /100 | #68 | Exceptional 2.1% |
| Immigrants | Romania | 99.8 /100 | #69 | Exceptional 2.1% |
| Egyptians | 99.8 /100 | #70 | Exceptional 2.1% |