Immigrants from the Azores vs Indian (Asian) Single Father Households
COMPARE
Immigrants from the Azores
Indian (Asian)
Single Father Households
Single Father Households Comparison
Immigrants from the Azores
Indians (Asian)
2.8%
SINGLE FATHER HOUSEHOLDS
0.0/ 100
METRIC RATING
306th/ 347
METRIC RANK
1.9%
SINGLE FATHER HOUSEHOLDS
100.0/ 100
METRIC RATING
18th/ 347
METRIC RANK
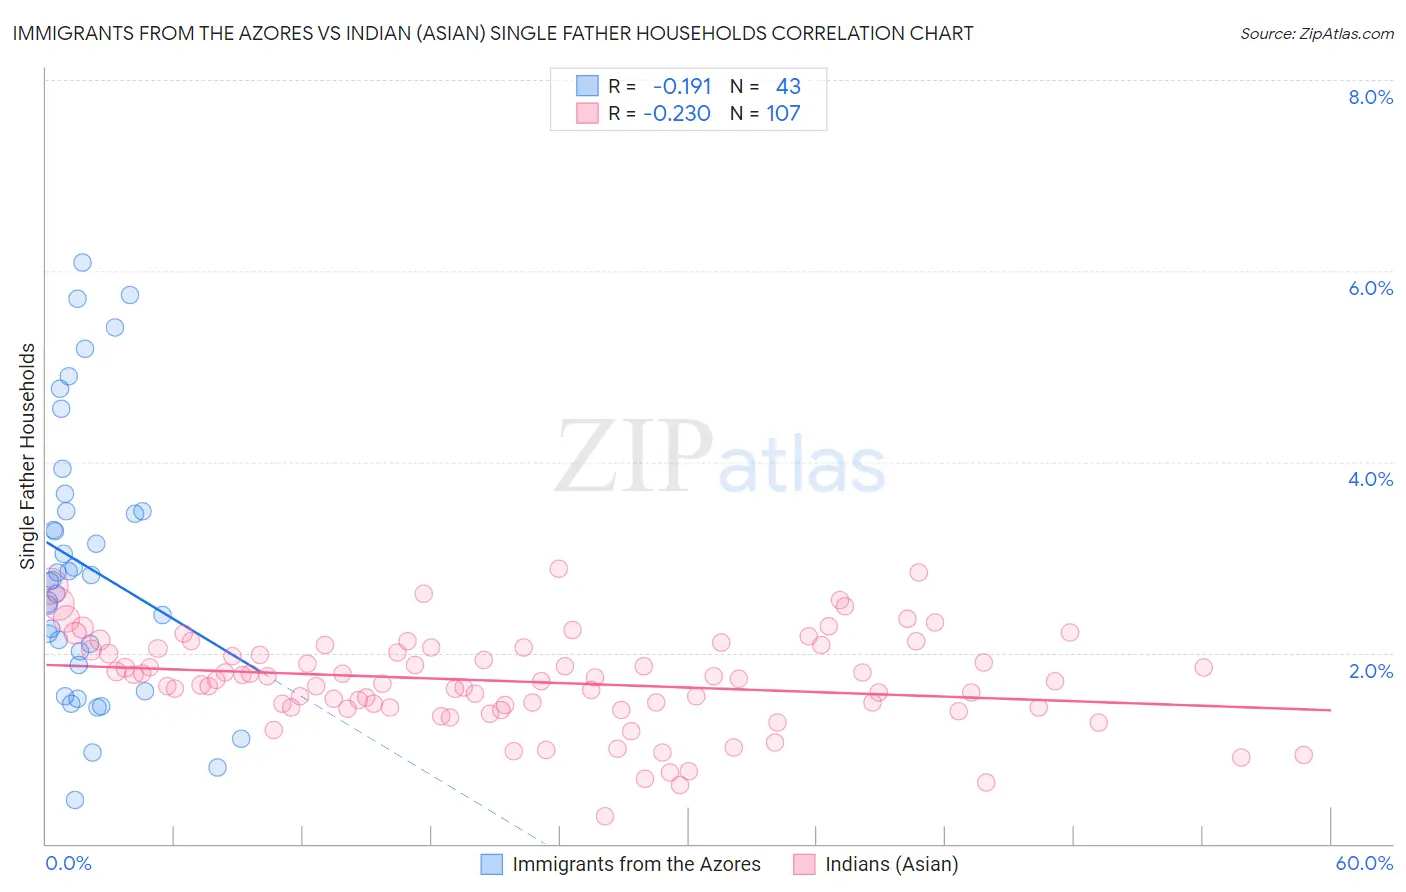
Immigrants from the Azores vs Indian (Asian) Single Father Households Correlation Chart
The statistical analysis conducted on geographies consisting of 46,035,225 people shows a poor negative correlation between the proportion of Immigrants from the Azores and percentage of single father households in the United States with a correlation coefficient (R) of -0.191 and weighted average of 2.8%. Similarly, the statistical analysis conducted on geographies consisting of 488,421,643 people shows a weak negative correlation between the proportion of Indians (Asian) and percentage of single father households in the United States with a correlation coefficient (R) of -0.230 and weighted average of 1.9%, a difference of 48.2%.
Single Father Households Correlation Summary
| Measurement | Immigrants from the Azores | Indian (Asian) |
| Minimum | 0.46% | 0.29% |
| Maximum | 6.1% | 2.9% |
| Range | 5.6% | 2.6% |
| Mean | 2.9% | 1.7% |
| Median | 2.8% | 1.7% |
| Interquartile 25% (IQ1) | 1.9% | 1.4% |
| Interquartile 75% (IQ3) | 3.5% | 2.0% |
| Interquartile Range (IQR) | 1.6% | 0.61% |
| Standard Deviation (Sample) | 1.4% | 0.49% |
| Standard Deviation (Population) | 1.4% | 0.49% |
Similar Demographics by Single Father Households
Demographics Similar to Immigrants from the Azores by Single Father Households
In terms of single father households, the demographic groups most similar to Immigrants from the Azores are Hispanic or Latino (2.8%, a difference of 0.16%), Hopi (2.8%, a difference of 0.17%), Mexican American Indian (2.8%, a difference of 0.31%), Apache (2.8%, a difference of 0.35%), and Immigrants from Honduras (2.8%, a difference of 0.63%).
| Demographics | Rating | Rank | Single Father Households |
| Lumbee | 0.0 /100 | #299 | Tragic 2.8% |
| Kiowa | 0.0 /100 | #300 | Tragic 2.8% |
| Immigrants | Latin America | 0.0 /100 | #301 | Tragic 2.8% |
| Spanish Americans | 0.0 /100 | #302 | Tragic 2.8% |
| Immigrants | Honduras | 0.0 /100 | #303 | Tragic 2.8% |
| Mexican American Indians | 0.0 /100 | #304 | Tragic 2.8% |
| Hispanics or Latinos | 0.0 /100 | #305 | Tragic 2.8% |
| Immigrants | Azores | 0.0 /100 | #306 | Tragic 2.8% |
| Hopi | 0.0 /100 | #307 | Tragic 2.8% |
| Apache | 0.0 /100 | #308 | Tragic 2.8% |
| Central Americans | 0.0 /100 | #309 | Tragic 2.9% |
| Immigrants | Laos | 0.0 /100 | #310 | Tragic 2.9% |
| Spanish American Indians | 0.0 /100 | #311 | Tragic 2.9% |
| Tsimshian | 0.0 /100 | #312 | Tragic 2.9% |
| Arapaho | 0.0 /100 | #313 | Tragic 2.9% |
Demographics Similar to Indians (Asian) by Single Father Households
In terms of single father households, the demographic groups most similar to Indians (Asian) are Immigrants from India (1.9%, a difference of 0.50%), Immigrants from Iran (1.9%, a difference of 0.72%), Iranian (1.9%, a difference of 0.84%), Thai (1.9%, a difference of 0.91%), and Immigrants from Eastern Asia (1.9%, a difference of 0.93%).
| Demographics | Rating | Rank | Single Father Households |
| Immigrants | Belarus | 100.0 /100 | #11 | Exceptional 1.9% |
| Immigrants | Greece | 100.0 /100 | #12 | Exceptional 1.9% |
| Immigrants | Singapore | 100.0 /100 | #13 | Exceptional 1.9% |
| Immigrants | Lithuania | 100.0 /100 | #14 | Exceptional 1.9% |
| Immigrants | Eastern Asia | 100.0 /100 | #15 | Exceptional 1.9% |
| Immigrants | Iran | 100.0 /100 | #16 | Exceptional 1.9% |
| Immigrants | India | 100.0 /100 | #17 | Exceptional 1.9% |
| Indians (Asian) | 100.0 /100 | #18 | Exceptional 1.9% |
| Iranians | 100.0 /100 | #19 | Exceptional 1.9% |
| Thais | 100.0 /100 | #20 | Exceptional 1.9% |
| Immigrants | Albania | 100.0 /100 | #21 | Exceptional 1.9% |
| Immigrants | Latvia | 100.0 /100 | #22 | Exceptional 1.9% |
| Immigrants | Croatia | 100.0 /100 | #23 | Exceptional 2.0% |
| Immigrants | Russia | 100.0 /100 | #24 | Exceptional 2.0% |
| Eastern Europeans | 100.0 /100 | #25 | Exceptional 2.0% |