Czech vs Immigrants from Uruguay Births to Unmarried Women
COMPARE
Czech
Immigrants from Uruguay
Births to Unmarried Women
Births to Unmarried Women Comparison
Czechs
Immigrants from Uruguay
30.5%
BIRTHS TO UNMARRIED WOMEN
82.1/ 100
METRIC RATING
144th/ 347
METRIC RANK
33.9%
BIRTHS TO UNMARRIED WOMEN
4.8/ 100
METRIC RATING
222nd/ 347
METRIC RANK
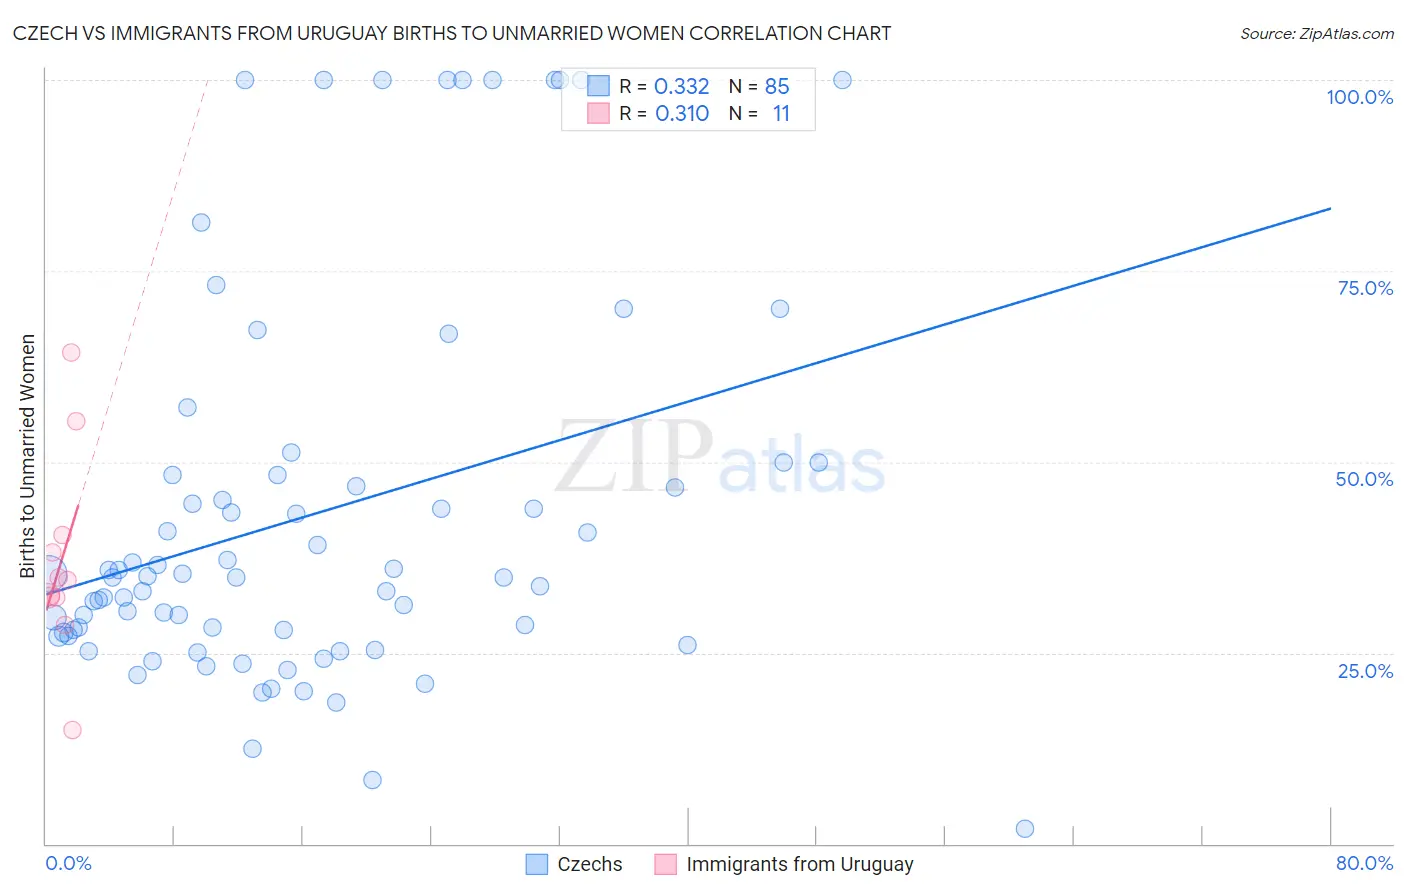
Czech vs Immigrants from Uruguay Births to Unmarried Women Correlation Chart
The statistical analysis conducted on geographies consisting of 439,200,510 people shows a mild positive correlation between the proportion of Czechs and percentage of births to unmarried women in the United States with a correlation coefficient (R) of 0.332 and weighted average of 30.5%. Similarly, the statistical analysis conducted on geographies consisting of 129,349,421 people shows a mild positive correlation between the proportion of Immigrants from Uruguay and percentage of births to unmarried women in the United States with a correlation coefficient (R) of 0.310 and weighted average of 33.9%, a difference of 11.1%.
Births to Unmarried Women Correlation Summary
| Measurement | Czech | Immigrants from Uruguay |
| Minimum | 1.9% | 14.9% |
| Maximum | 100.0% | 64.3% |
| Range | 98.1% | 49.4% |
| Mean | 43.1% | 37.1% |
| Median | 34.9% | 34.5% |
| Interquartile 25% (IQ1) | 27.4% | 32.2% |
| Interquartile 75% (IQ3) | 48.3% | 40.5% |
| Interquartile Range (IQR) | 20.8% | 8.2% |
| Standard Deviation (Sample) | 25.0% | 13.1% |
| Standard Deviation (Population) | 24.9% | 12.5% |
Similar Demographics by Births to Unmarried Women
Demographics Similar to Czechs by Births to Unmarried Women
In terms of births to unmarried women, the demographic groups most similar to Czechs are Immigrants from Uganda (30.5%, a difference of 0.070%), South African (30.5%, a difference of 0.090%), Immigrants from North America (30.6%, a difference of 0.10%), Northern European (30.6%, a difference of 0.13%), and Pakistani (30.5%, a difference of 0.15%).
| Demographics | Rating | Rank | Births to Unmarried Women |
| Immigrants | Philippines | 83.9 /100 | #137 | Excellent 30.4% |
| Puget Sound Salish | 83.9 /100 | #138 | Excellent 30.4% |
| Immigrants | Canada | 83.7 /100 | #139 | Excellent 30.4% |
| Swiss | 83.1 /100 | #140 | Excellent 30.5% |
| Pakistanis | 83.0 /100 | #141 | Excellent 30.5% |
| South Africans | 82.7 /100 | #142 | Excellent 30.5% |
| Immigrants | Uganda | 82.6 /100 | #143 | Excellent 30.5% |
| Czechs | 82.1 /100 | #144 | Excellent 30.5% |
| Immigrants | North America | 81.5 /100 | #145 | Excellent 30.6% |
| Northern Europeans | 81.4 /100 | #146 | Excellent 30.6% |
| Immigrants | Oceania | 81.2 /100 | #147 | Excellent 30.6% |
| Chileans | 79.1 /100 | #148 | Good 30.7% |
| Serbians | 78.8 /100 | #149 | Good 30.7% |
| Somalis | 77.8 /100 | #150 | Good 30.7% |
| Italians | 77.0 /100 | #151 | Good 30.8% |
Demographics Similar to Immigrants from Uruguay by Births to Unmarried Women
In terms of births to unmarried women, the demographic groups most similar to Immigrants from Uruguay are Malaysian (33.9%, a difference of 0.060%), Portuguese (33.8%, a difference of 0.24%), Alsatian (33.8%, a difference of 0.26%), Pennsylvania German (34.0%, a difference of 0.29%), and Immigrants from Laos (34.0%, a difference of 0.29%).
| Demographics | Rating | Rank | Births to Unmarried Women |
| French | 8.7 /100 | #215 | Tragic 33.4% |
| Nepalese | 7.8 /100 | #216 | Tragic 33.5% |
| Spaniards | 7.0 /100 | #217 | Tragic 33.6% |
| Immigrants | Ecuador | 5.9 /100 | #218 | Tragic 33.7% |
| Alsatians | 5.4 /100 | #219 | Tragic 33.8% |
| Portuguese | 5.4 /100 | #220 | Tragic 33.8% |
| Malaysians | 5.0 /100 | #221 | Tragic 33.9% |
| Immigrants | Uruguay | 4.8 /100 | #222 | Tragic 33.9% |
| Pennsylvania Germans | 4.3 /100 | #223 | Tragic 34.0% |
| Immigrants | Laos | 4.3 /100 | #224 | Tragic 34.0% |
| Spanish | 4.0 /100 | #225 | Tragic 34.1% |
| Delaware | 3.3 /100 | #226 | Tragic 34.2% |
| Immigrants | Panama | 3.3 /100 | #227 | Tragic 34.2% |
| Panamanians | 3.3 /100 | #228 | Tragic 34.2% |
| Immigrants | Sierra Leone | 3.1 /100 | #229 | Tragic 34.2% |