Salvadoran vs Immigrants from Latvia Single Father Households
COMPARE
Salvadoran
Immigrants from Latvia
Single Father Households
Single Father Households Comparison
Salvadorans
Immigrants from Latvia
2.9%
SINGLE FATHER HOUSEHOLDS
0.0/ 100
METRIC RATING
314th/ 347
METRIC RANK
1.9%
SINGLE FATHER HOUSEHOLDS
100.0/ 100
METRIC RATING
22nd/ 347
METRIC RANK
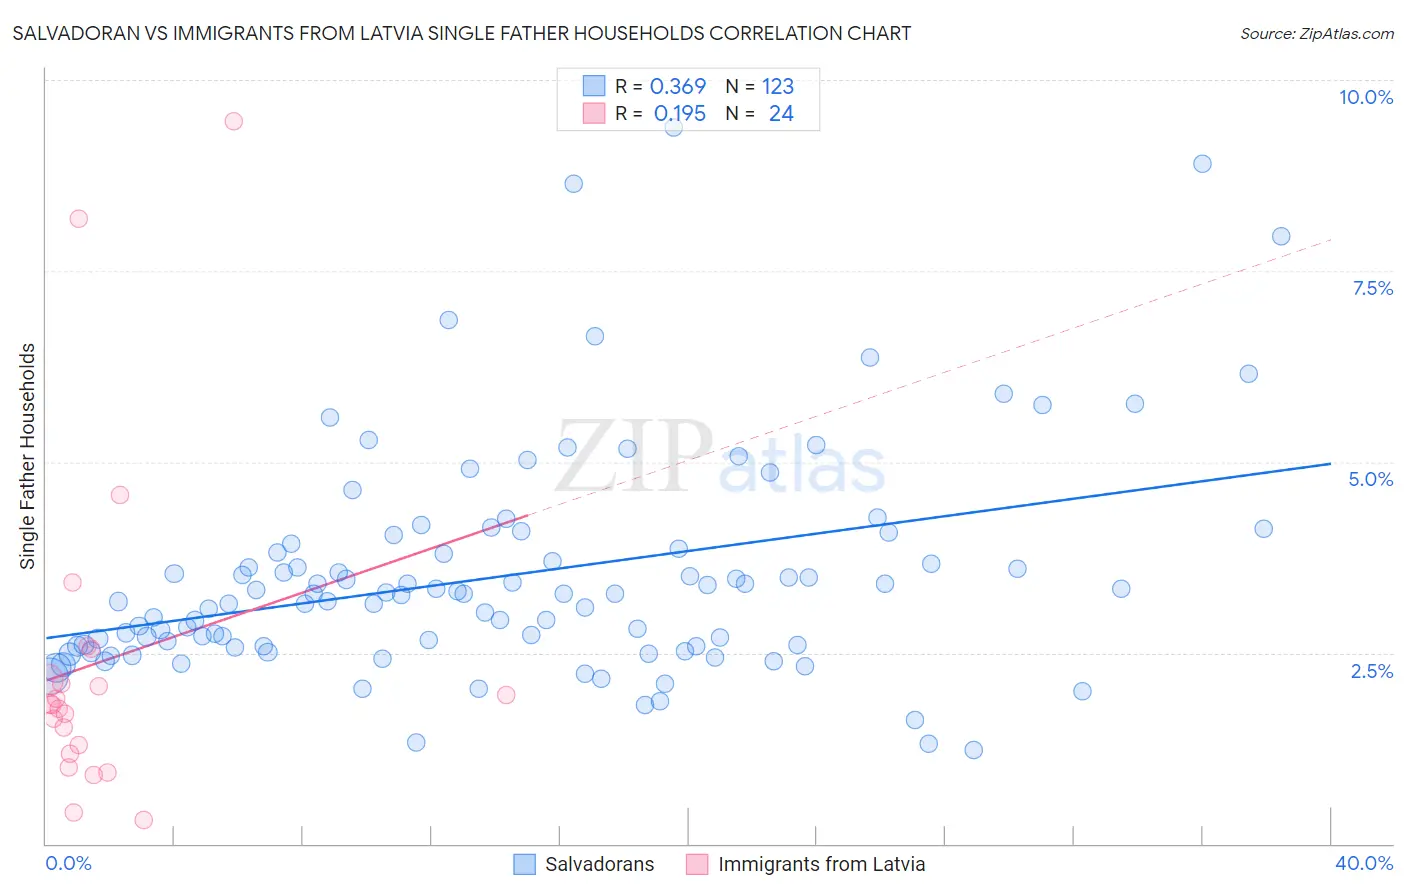
Salvadoran vs Immigrants from Latvia Single Father Households Correlation Chart
The statistical analysis conducted on geographies consisting of 395,913,017 people shows a mild positive correlation between the proportion of Salvadorans and percentage of single father households in the United States with a correlation coefficient (R) of 0.369 and weighted average of 2.9%. Similarly, the statistical analysis conducted on geographies consisting of 113,497,933 people shows a poor positive correlation between the proportion of Immigrants from Latvia and percentage of single father households in the United States with a correlation coefficient (R) of 0.195 and weighted average of 1.9%, a difference of 50.5%.
Single Father Households Correlation Summary
| Measurement | Salvadoran | Immigrants from Latvia |
| Minimum | 1.2% | 0.31% |
| Maximum | 9.4% | 9.5% |
| Range | 8.1% | 9.1% |
| Mean | 3.5% | 2.4% |
| Median | 3.3% | 1.8% |
| Interquartile 25% (IQ1) | 2.6% | 1.2% |
| Interquartile 75% (IQ3) | 3.9% | 2.3% |
| Interquartile Range (IQR) | 1.3% | 1.1% |
| Standard Deviation (Sample) | 1.5% | 2.2% |
| Standard Deviation (Population) | 1.5% | 2.1% |
Similar Demographics by Single Father Households
Demographics Similar to Salvadorans by Single Father Households
In terms of single father households, the demographic groups most similar to Salvadorans are Arapaho (2.9%, a difference of 0.25%), Cheyenne (2.9%, a difference of 0.39%), Houma (2.9%, a difference of 0.39%), Tsimshian (2.9%, a difference of 0.67%), and Spanish American Indian (2.9%, a difference of 1.2%).
| Demographics | Rating | Rank | Single Father Households |
| Hopi | 0.0 /100 | #307 | Tragic 2.8% |
| Apache | 0.0 /100 | #308 | Tragic 2.8% |
| Central Americans | 0.0 /100 | #309 | Tragic 2.9% |
| Immigrants | Laos | 0.0 /100 | #310 | Tragic 2.9% |
| Spanish American Indians | 0.0 /100 | #311 | Tragic 2.9% |
| Tsimshian | 0.0 /100 | #312 | Tragic 2.9% |
| Arapaho | 0.0 /100 | #313 | Tragic 2.9% |
| Salvadorans | 0.0 /100 | #314 | Tragic 2.9% |
| Cheyenne | 0.0 /100 | #315 | Tragic 2.9% |
| Houma | 0.0 /100 | #316 | Tragic 2.9% |
| Immigrants | El Salvador | 0.0 /100 | #317 | Tragic 2.9% |
| Cape Verdeans | 0.0 /100 | #318 | Tragic 2.9% |
| Ute | 0.0 /100 | #319 | Tragic 3.0% |
| Guatemalans | 0.0 /100 | #320 | Tragic 3.0% |
| Mexicans | 0.0 /100 | #321 | Tragic 3.0% |
Demographics Similar to Immigrants from Latvia by Single Father Households
In terms of single father households, the demographic groups most similar to Immigrants from Latvia are Immigrants from Albania (1.9%, a difference of 0.19%), Thai (1.9%, a difference of 0.49%), Iranian (1.9%, a difference of 0.56%), Immigrants from Croatia (2.0%, a difference of 1.2%), and Immigrants from Russia (2.0%, a difference of 1.2%).
| Demographics | Rating | Rank | Single Father Households |
| Immigrants | Eastern Asia | 100.0 /100 | #15 | Exceptional 1.9% |
| Immigrants | Iran | 100.0 /100 | #16 | Exceptional 1.9% |
| Immigrants | India | 100.0 /100 | #17 | Exceptional 1.9% |
| Indians (Asian) | 100.0 /100 | #18 | Exceptional 1.9% |
| Iranians | 100.0 /100 | #19 | Exceptional 1.9% |
| Thais | 100.0 /100 | #20 | Exceptional 1.9% |
| Immigrants | Albania | 100.0 /100 | #21 | Exceptional 1.9% |
| Immigrants | Latvia | 100.0 /100 | #22 | Exceptional 1.9% |
| Immigrants | Croatia | 100.0 /100 | #23 | Exceptional 2.0% |
| Immigrants | Russia | 100.0 /100 | #24 | Exceptional 2.0% |
| Eastern Europeans | 100.0 /100 | #25 | Exceptional 2.0% |
| Assyrians/Chaldeans/Syriacs | 100.0 /100 | #26 | Exceptional 2.0% |
| Immigrants | South Central Asia | 100.0 /100 | #27 | Exceptional 2.0% |
| Immigrants | Japan | 100.0 /100 | #28 | Exceptional 2.0% |
| Bulgarians | 100.0 /100 | #29 | Exceptional 2.0% |