Immigrants from Malaysia vs Immigrants from Latvia Single Father Households
COMPARE
Immigrants from Malaysia
Immigrants from Latvia
Single Father Households
Single Father Households Comparison
Immigrants from Malaysia
Immigrants from Latvia
2.0%
SINGLE FATHER HOUSEHOLDS
99.9/ 100
METRIC RATING
62nd/ 347
METRIC RANK
1.9%
SINGLE FATHER HOUSEHOLDS
100.0/ 100
METRIC RATING
22nd/ 347
METRIC RANK
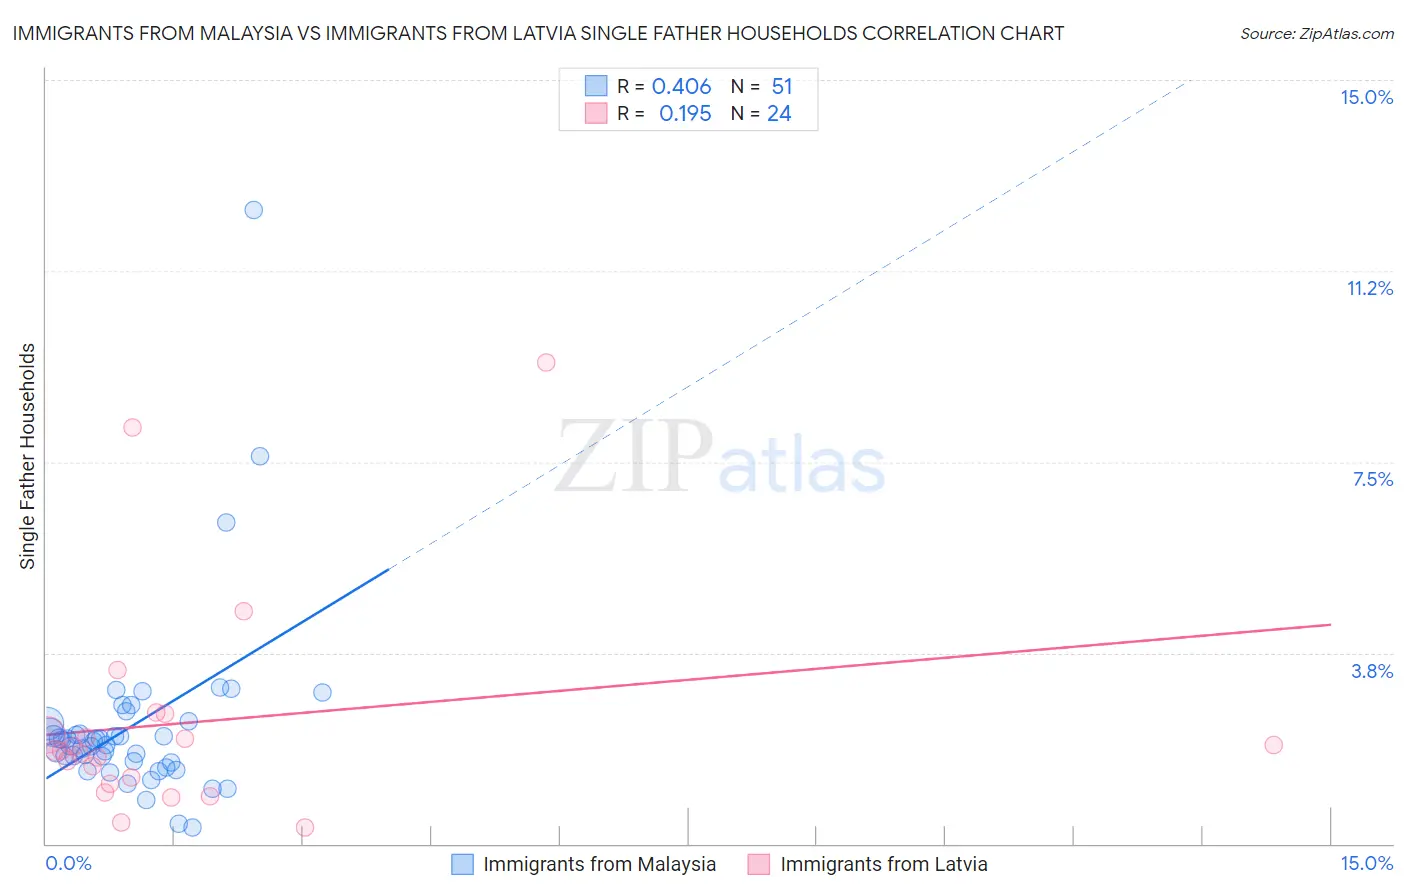
Immigrants from Malaysia vs Immigrants from Latvia Single Father Households Correlation Chart
The statistical analysis conducted on geographies consisting of 197,425,909 people shows a moderate positive correlation between the proportion of Immigrants from Malaysia and percentage of single father households in the United States with a correlation coefficient (R) of 0.406 and weighted average of 2.0%. Similarly, the statistical analysis conducted on geographies consisting of 113,497,933 people shows a poor positive correlation between the proportion of Immigrants from Latvia and percentage of single father households in the United States with a correlation coefficient (R) of 0.195 and weighted average of 1.9%, a difference of 5.8%.
Single Father Households Correlation Summary
| Measurement | Immigrants from Malaysia | Immigrants from Latvia |
| Minimum | 0.33% | 0.31% |
| Maximum | 12.5% | 9.5% |
| Range | 12.1% | 9.1% |
| Mean | 2.3% | 2.4% |
| Median | 2.0% | 1.8% |
| Interquartile 25% (IQ1) | 1.6% | 1.2% |
| Interquartile 75% (IQ3) | 2.4% | 2.3% |
| Interquartile Range (IQR) | 0.77% | 1.1% |
| Standard Deviation (Sample) | 1.9% | 2.2% |
| Standard Deviation (Population) | 1.8% | 2.1% |
Similar Demographics by Single Father Households
Demographics Similar to Immigrants from Malaysia by Single Father Households
In terms of single father households, the demographic groups most similar to Immigrants from Malaysia are Vietnamese (2.0%, a difference of 0.20%), Maltese (2.0%, a difference of 0.20%), Mongolian (2.1%, a difference of 0.34%), Paraguayan (2.1%, a difference of 0.37%), and Immigrants from North Macedonia (2.0%, a difference of 0.44%).
| Demographics | Rating | Rank | Single Father Households |
| Immigrants | France | 99.9 /100 | #55 | Exceptional 2.0% |
| Immigrants | Norway | 99.9 /100 | #56 | Exceptional 2.0% |
| Burmese | 99.9 /100 | #57 | Exceptional 2.0% |
| Immigrants | Czechoslovakia | 99.9 /100 | #58 | Exceptional 2.0% |
| Immigrants | North Macedonia | 99.9 /100 | #59 | Exceptional 2.0% |
| Immigrants | Austria | 99.9 /100 | #60 | Exceptional 2.0% |
| Vietnamese | 99.9 /100 | #61 | Exceptional 2.0% |
| Immigrants | Malaysia | 99.9 /100 | #62 | Exceptional 2.0% |
| Maltese | 99.9 /100 | #63 | Exceptional 2.0% |
| Mongolians | 99.9 /100 | #64 | Exceptional 2.1% |
| Paraguayans | 99.9 /100 | #65 | Exceptional 2.1% |
| Immigrants | Western Asia | 99.8 /100 | #66 | Exceptional 2.1% |
| Immigrants | Italy | 99.8 /100 | #67 | Exceptional 2.1% |
| Immigrants | Denmark | 99.8 /100 | #68 | Exceptional 2.1% |
| Immigrants | Romania | 99.8 /100 | #69 | Exceptional 2.1% |
Demographics Similar to Immigrants from Latvia by Single Father Households
In terms of single father households, the demographic groups most similar to Immigrants from Latvia are Immigrants from Albania (1.9%, a difference of 0.19%), Thai (1.9%, a difference of 0.49%), Iranian (1.9%, a difference of 0.56%), Immigrants from Croatia (2.0%, a difference of 1.2%), and Immigrants from Russia (2.0%, a difference of 1.2%).
| Demographics | Rating | Rank | Single Father Households |
| Immigrants | Eastern Asia | 100.0 /100 | #15 | Exceptional 1.9% |
| Immigrants | Iran | 100.0 /100 | #16 | Exceptional 1.9% |
| Immigrants | India | 100.0 /100 | #17 | Exceptional 1.9% |
| Indians (Asian) | 100.0 /100 | #18 | Exceptional 1.9% |
| Iranians | 100.0 /100 | #19 | Exceptional 1.9% |
| Thais | 100.0 /100 | #20 | Exceptional 1.9% |
| Immigrants | Albania | 100.0 /100 | #21 | Exceptional 1.9% |
| Immigrants | Latvia | 100.0 /100 | #22 | Exceptional 1.9% |
| Immigrants | Croatia | 100.0 /100 | #23 | Exceptional 2.0% |
| Immigrants | Russia | 100.0 /100 | #24 | Exceptional 2.0% |
| Eastern Europeans | 100.0 /100 | #25 | Exceptional 2.0% |
| Assyrians/Chaldeans/Syriacs | 100.0 /100 | #26 | Exceptional 2.0% |
| Immigrants | South Central Asia | 100.0 /100 | #27 | Exceptional 2.0% |
| Immigrants | Japan | 100.0 /100 | #28 | Exceptional 2.0% |
| Bulgarians | 100.0 /100 | #29 | Exceptional 2.0% |