Romanian vs Spanish Births to Unmarried Women
COMPARE
Romanian
Spanish
Births to Unmarried Women
Births to Unmarried Women Comparison
Romanians
Spanish
28.7%
BIRTHS TO UNMARRIED WOMEN
98.0/ 100
METRIC RATING
82nd/ 347
METRIC RANK
34.1%
BIRTHS TO UNMARRIED WOMEN
4.0/ 100
METRIC RATING
225th/ 347
METRIC RANK
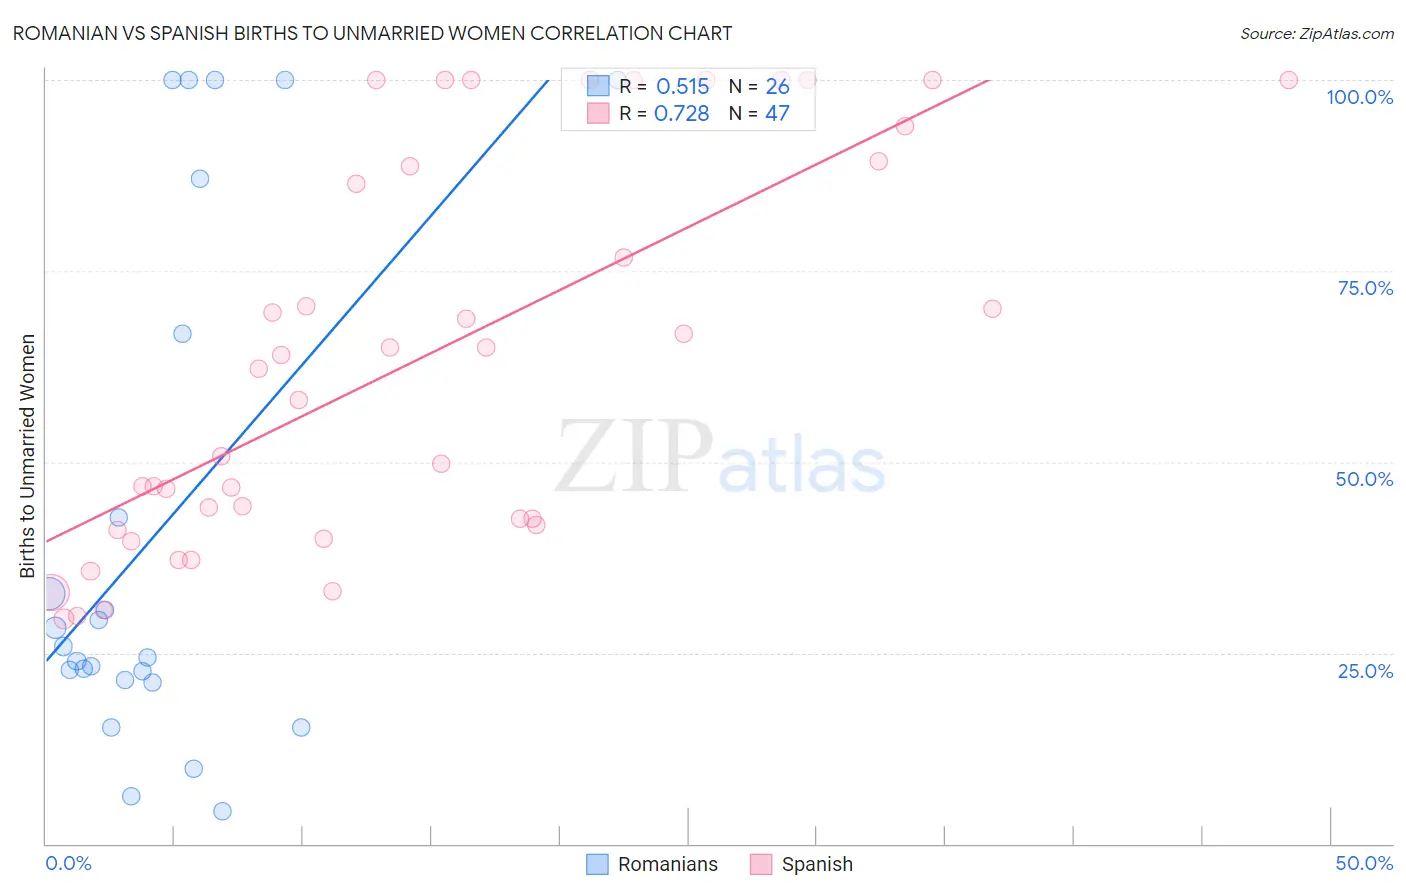
Romanian vs Spanish Births to Unmarried Women Correlation Chart
The statistical analysis conducted on geographies consisting of 350,464,918 people shows a substantial positive correlation between the proportion of Romanians and percentage of births to unmarried women in the United States with a correlation coefficient (R) of 0.515 and weighted average of 28.7%. Similarly, the statistical analysis conducted on geographies consisting of 393,000,764 people shows a strong positive correlation between the proportion of Spanish and percentage of births to unmarried women in the United States with a correlation coefficient (R) of 0.728 and weighted average of 34.1%, a difference of 18.5%.
Births to Unmarried Women Correlation Summary
| Measurement | Romanian | Spanish |
| Minimum | 4.3% | 29.5% |
| Maximum | 100.0% | 100.0% |
| Range | 95.7% | 70.5% |
| Mean | 41.4% | 63.5% |
| Median | 25.1% | 62.2% |
| Interquartile 25% (IQ1) | 21.4% | 41.7% |
| Interquartile 75% (IQ3) | 66.7% | 89.4% |
| Interquartile Range (IQR) | 45.3% | 47.7% |
| Standard Deviation (Sample) | 33.7% | 25.1% |
| Standard Deviation (Population) | 33.1% | 24.9% |
Similar Demographics by Births to Unmarried Women
Demographics Similar to Romanians by Births to Unmarried Women
In terms of births to unmarried women, the demographic groups most similar to Romanians are Immigrants from Kuwait (28.8%, a difference of 0.080%), Immigrants from Austria (28.7%, a difference of 0.11%), Immigrants from Afghanistan (28.7%, a difference of 0.15%), Danish (28.7%, a difference of 0.18%), and Zimbabwean (28.7%, a difference of 0.20%).
| Demographics | Rating | Rank | Births to Unmarried Women |
| Immigrants | Switzerland | 98.4 /100 | #75 | Exceptional 28.6% |
| Israelis | 98.4 /100 | #76 | Exceptional 28.6% |
| Immigrants | Northern Europe | 98.3 /100 | #77 | Exceptional 28.6% |
| Zimbabweans | 98.2 /100 | #78 | Exceptional 28.7% |
| Danes | 98.2 /100 | #79 | Exceptional 28.7% |
| Immigrants | Afghanistan | 98.1 /100 | #80 | Exceptional 28.7% |
| Immigrants | Austria | 98.1 /100 | #81 | Exceptional 28.7% |
| Romanians | 98.0 /100 | #82 | Exceptional 28.7% |
| Immigrants | Kuwait | 98.0 /100 | #83 | Exceptional 28.8% |
| Immigrants | Poland | 97.6 /100 | #84 | Exceptional 28.9% |
| Sri Lankans | 97.5 /100 | #85 | Exceptional 28.9% |
| Immigrants | Jordan | 97.4 /100 | #86 | Exceptional 29.0% |
| Taiwanese | 97.3 /100 | #87 | Exceptional 29.0% |
| Immigrants | France | 97.3 /100 | #88 | Exceptional 29.0% |
| Immigrants | Saudi Arabia | 97.0 /100 | #89 | Exceptional 29.1% |
Demographics Similar to Spanish by Births to Unmarried Women
In terms of births to unmarried women, the demographic groups most similar to Spanish are Immigrants from Laos (34.0%, a difference of 0.16%), Pennsylvania German (34.0%, a difference of 0.17%), Delaware (34.2%, a difference of 0.39%), Immigrants from Panama (34.2%, a difference of 0.41%), and Panamanian (34.2%, a difference of 0.44%).
| Demographics | Rating | Rank | Births to Unmarried Women |
| Immigrants | Ecuador | 5.9 /100 | #218 | Tragic 33.7% |
| Alsatians | 5.4 /100 | #219 | Tragic 33.8% |
| Portuguese | 5.4 /100 | #220 | Tragic 33.8% |
| Malaysians | 5.0 /100 | #221 | Tragic 33.9% |
| Immigrants | Uruguay | 4.8 /100 | #222 | Tragic 33.9% |
| Pennsylvania Germans | 4.3 /100 | #223 | Tragic 34.0% |
| Immigrants | Laos | 4.3 /100 | #224 | Tragic 34.0% |
| Spanish | 4.0 /100 | #225 | Tragic 34.1% |
| Delaware | 3.3 /100 | #226 | Tragic 34.2% |
| Immigrants | Panama | 3.3 /100 | #227 | Tragic 34.2% |
| Panamanians | 3.3 /100 | #228 | Tragic 34.2% |
| Immigrants | Sierra Leone | 3.1 /100 | #229 | Tragic 34.2% |
| Ghanaians | 3.1 /100 | #230 | Tragic 34.3% |
| Native Hawaiians | 2.9 /100 | #231 | Tragic 34.3% |
| French Canadians | 2.5 /100 | #232 | Tragic 34.4% |