Romanian vs Israeli Births to Unmarried Women
COMPARE
Romanian
Israeli
Births to Unmarried Women
Births to Unmarried Women Comparison
Romanians
Israelis
28.7%
BIRTHS TO UNMARRIED WOMEN
98.0/ 100
METRIC RATING
82nd/ 347
METRIC RANK
28.6%
BIRTHS TO UNMARRIED WOMEN
98.4/ 100
METRIC RATING
76th/ 347
METRIC RANK
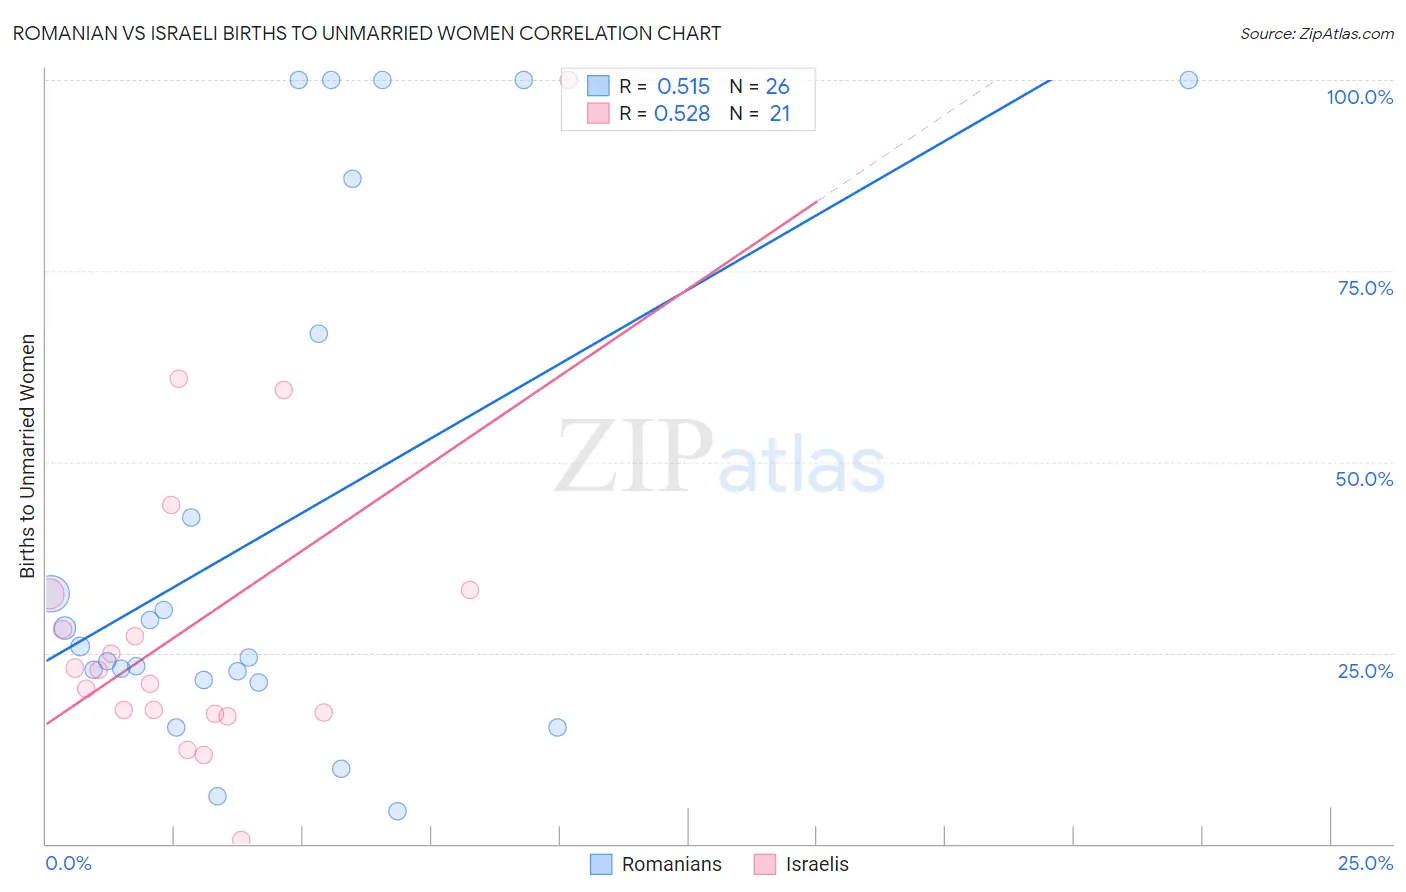
Romanian vs Israeli Births to Unmarried Women Correlation Chart
The statistical analysis conducted on geographies consisting of 350,464,918 people shows a substantial positive correlation between the proportion of Romanians and percentage of births to unmarried women in the United States with a correlation coefficient (R) of 0.515 and weighted average of 28.7%. Similarly, the statistical analysis conducted on geographies consisting of 199,706,884 people shows a substantial positive correlation between the proportion of Israelis and percentage of births to unmarried women in the United States with a correlation coefficient (R) of 0.528 and weighted average of 28.6%, a difference of 0.56%.
Births to Unmarried Women Correlation Summary
| Measurement | Romanian | Israeli |
| Minimum | 4.3% | 0.50% |
| Maximum | 100.0% | 100.0% |
| Range | 95.7% | 99.5% |
| Mean | 41.4% | 28.9% |
| Median | 25.1% | 22.7% |
| Interquartile 25% (IQ1) | 21.4% | 17.1% |
| Interquartile 75% (IQ3) | 66.7% | 33.0% |
| Interquartile Range (IQR) | 45.3% | 15.9% |
| Standard Deviation (Sample) | 33.7% | 21.9% |
| Standard Deviation (Population) | 33.1% | 21.4% |
Demographics Similar to Romanians and Israelis by Births to Unmarried Women
In terms of births to unmarried women, the demographic groups most similar to Romanians are Immigrants from Kuwait (28.8%, a difference of 0.080%), Immigrants from Austria (28.7%, a difference of 0.11%), Immigrants from Afghanistan (28.7%, a difference of 0.15%), Danish (28.7%, a difference of 0.18%), and Zimbabwean (28.7%, a difference of 0.20%). Similarly, the demographic groups most similar to Israelis are Immigrants from Switzerland (28.6%, a difference of 0.020%), Immigrants from Bolivia (28.6%, a difference of 0.10%), Albanian (28.5%, a difference of 0.13%), Immigrants from Sweden (28.5%, a difference of 0.18%), and Immigrants from Northern Europe (28.6%, a difference of 0.19%).
| Demographics | Rating | Rank | Births to Unmarried Women |
| Bolivians | 98.7 /100 | #69 | Exceptional 28.5% |
| Laotians | 98.6 /100 | #70 | Exceptional 28.5% |
| Jordanians | 98.5 /100 | #71 | Exceptional 28.5% |
| Immigrants | Sweden | 98.5 /100 | #72 | Exceptional 28.5% |
| Albanians | 98.5 /100 | #73 | Exceptional 28.5% |
| Immigrants | Bolivia | 98.5 /100 | #74 | Exceptional 28.6% |
| Immigrants | Switzerland | 98.4 /100 | #75 | Exceptional 28.6% |
| Israelis | 98.4 /100 | #76 | Exceptional 28.6% |
| Immigrants | Northern Europe | 98.3 /100 | #77 | Exceptional 28.6% |
| Zimbabweans | 98.2 /100 | #78 | Exceptional 28.7% |
| Danes | 98.2 /100 | #79 | Exceptional 28.7% |
| Immigrants | Afghanistan | 98.1 /100 | #80 | Exceptional 28.7% |
| Immigrants | Austria | 98.1 /100 | #81 | Exceptional 28.7% |
| Romanians | 98.0 /100 | #82 | Exceptional 28.7% |
| Immigrants | Kuwait | 98.0 /100 | #83 | Exceptional 28.8% |
| Immigrants | Poland | 97.6 /100 | #84 | Exceptional 28.9% |
| Sri Lankans | 97.5 /100 | #85 | Exceptional 28.9% |
| Immigrants | Jordan | 97.4 /100 | #86 | Exceptional 29.0% |
| Taiwanese | 97.3 /100 | #87 | Exceptional 29.0% |
| Immigrants | France | 97.3 /100 | #88 | Exceptional 29.0% |
| Immigrants | Saudi Arabia | 97.0 /100 | #89 | Exceptional 29.1% |