Immigrants from Nigeria vs Delaware Average Family Size
COMPARE
Immigrants from Nigeria
Delaware
Average Family Size
Average Family Size Comparison
Immigrants from Nigeria
Delaware
3.32
AVERAGE FAMILY SIZE
99.7/ 100
METRIC RATING
84th/ 347
METRIC RANK
3.20
AVERAGE FAMILY SIZE
11.1/ 100
METRIC RATING
215th/ 347
METRIC RANK
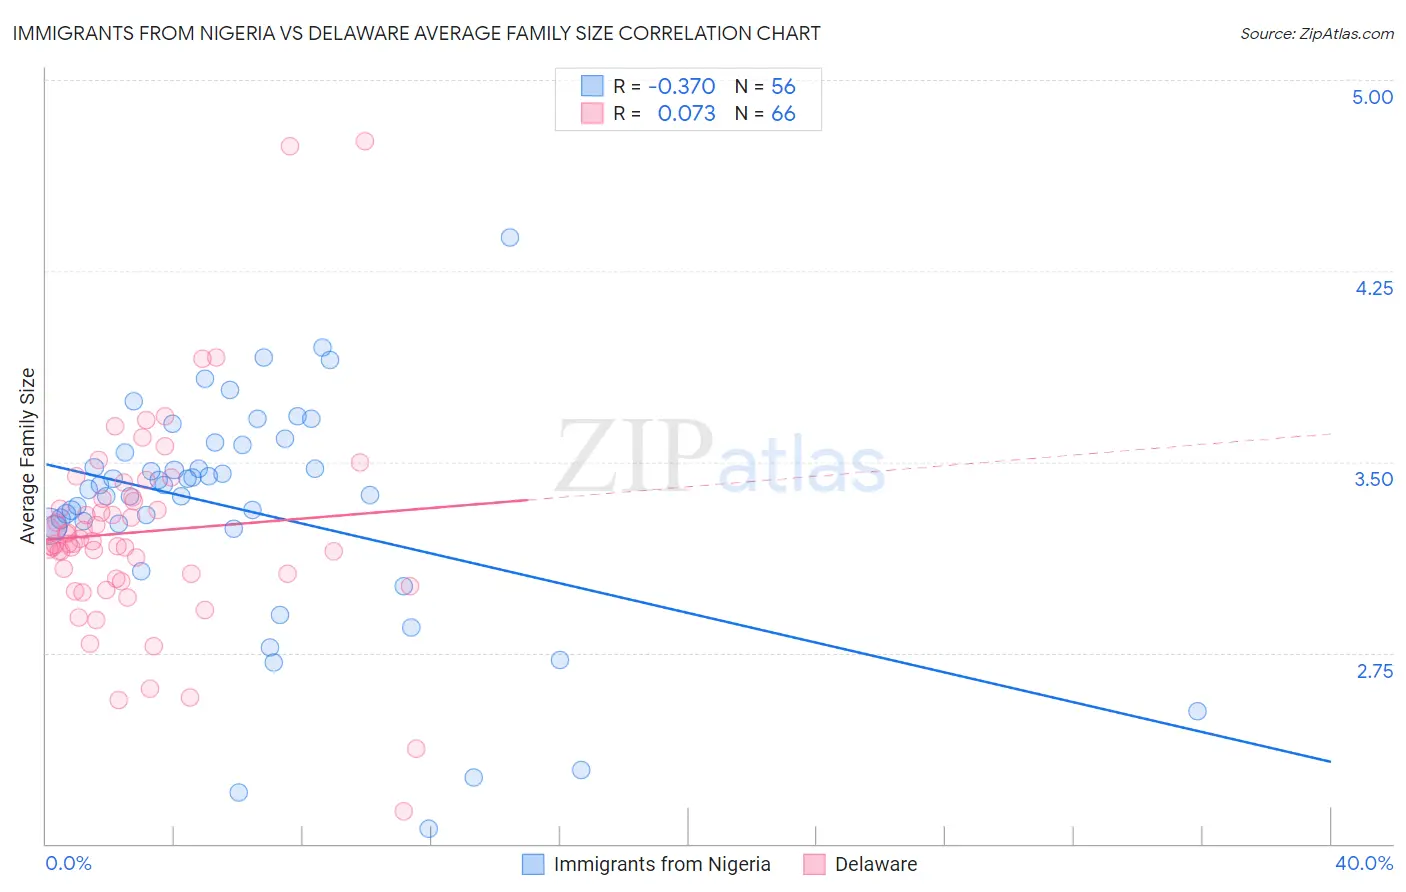
Immigrants from Nigeria vs Delaware Average Family Size Correlation Chart
The statistical analysis conducted on geographies consisting of 283,303,904 people shows a mild negative correlation between the proportion of Immigrants from Nigeria and average family size in the United States with a correlation coefficient (R) of -0.370 and weighted average of 3.32. Similarly, the statistical analysis conducted on geographies consisting of 96,226,564 people shows a slight positive correlation between the proportion of Delaware and average family size in the United States with a correlation coefficient (R) of 0.073 and weighted average of 3.20, a difference of 3.7%.
Average Family Size Correlation Summary
| Measurement | Immigrants from Nigeria | Delaware |
| Minimum | 2.06 | 2.13 |
| Maximum | 4.38 | 4.76 |
| Range | 2.32 | 2.63 |
| Mean | 3.31 | 3.22 |
| Median | 3.40 | 3.18 |
| Interquartile 25% (IQ1) | 3.24 | 3.04 |
| Interquartile 75% (IQ3) | 3.55 | 3.35 |
| Interquartile Range (IQR) | 0.31 | 0.31 |
| Standard Deviation (Sample) | 0.45 | 0.41 |
| Standard Deviation (Population) | 0.44 | 0.41 |
Similar Demographics by Average Family Size
Demographics Similar to Immigrants from Nigeria by Average Family Size
In terms of average family size, the demographic groups most similar to Immigrants from Nigeria are Immigrants from Afghanistan (3.32, a difference of 0.030%), Afghan (3.31, a difference of 0.040%), Ecuadorian (3.32, a difference of 0.050%), Jamaican (3.31, a difference of 0.060%), and Immigrants from Dominica (3.32, a difference of 0.080%).
| Demographics | Rating | Rank | Average Family Size |
| Immigrants | Ecuador | 99.8 /100 | #77 | Exceptional 3.32 |
| Immigrants | Micronesia | 99.8 /100 | #78 | Exceptional 3.32 |
| British West Indians | 99.8 /100 | #79 | Exceptional 3.32 |
| Lumbee | 99.8 /100 | #80 | Exceptional 3.32 |
| Immigrants | Dominica | 99.8 /100 | #81 | Exceptional 3.32 |
| Ecuadorians | 99.8 /100 | #82 | Exceptional 3.32 |
| Immigrants | Afghanistan | 99.8 /100 | #83 | Exceptional 3.32 |
| Immigrants | Nigeria | 99.7 /100 | #84 | Exceptional 3.32 |
| Afghans | 99.7 /100 | #85 | Exceptional 3.31 |
| Jamaicans | 99.7 /100 | #86 | Exceptional 3.31 |
| Immigrants | Peru | 99.7 /100 | #87 | Exceptional 3.31 |
| Immigrants | Bolivia | 99.6 /100 | #88 | Exceptional 3.31 |
| Malaysians | 99.6 /100 | #89 | Exceptional 3.31 |
| Menominee | 99.4 /100 | #90 | Exceptional 3.30 |
| Immigrants | Pakistan | 99.2 /100 | #91 | Exceptional 3.30 |
Demographics Similar to Delaware by Average Family Size
In terms of average family size, the demographic groups most similar to Delaware are Bermudan (3.20, a difference of 0.0%), Somali (3.20, a difference of 0.010%), Mongolian (3.20, a difference of 0.020%), Immigrants from Somalia (3.20, a difference of 0.040%), and Immigrants from Iran (3.20, a difference of 0.050%).
| Demographics | Rating | Rank | Average Family Size |
| Chippewa | 13.3 /100 | #208 | Poor 3.20 |
| Sudanese | 13.3 /100 | #209 | Poor 3.20 |
| Zimbabweans | 12.6 /100 | #210 | Poor 3.20 |
| Immigrants | Iran | 12.1 /100 | #211 | Poor 3.20 |
| Creek | 12.1 /100 | #212 | Poor 3.20 |
| Mongolians | 11.5 /100 | #213 | Poor 3.20 |
| Somalis | 11.2 /100 | #214 | Poor 3.20 |
| Delaware | 11.1 /100 | #215 | Poor 3.20 |
| Bermudans | 11.0 /100 | #216 | Poor 3.20 |
| Immigrants | Somalia | 10.3 /100 | #217 | Poor 3.20 |
| French American Indians | 9.8 /100 | #218 | Tragic 3.20 |
| Pennsylvania Germans | 9.3 /100 | #219 | Tragic 3.19 |
| Lebanese | 9.1 /100 | #220 | Tragic 3.19 |
| Immigrants | Ukraine | 7.2 /100 | #221 | Tragic 3.19 |
| Immigrants | Kuwait | 7.2 /100 | #222 | Tragic 3.19 |