Immigrants from South Central Asia vs Immigrants from Panama Average Family Size
COMPARE
Immigrants from South Central Asia
Immigrants from Panama
Average Family Size
Average Family Size Comparison
Immigrants from South Central Asia
Immigrants from Panama
3.23
AVERAGE FAMILY SIZE
50.0/ 100
METRIC RATING
174th/ 347
METRIC RANK
3.27
AVERAGE FAMILY SIZE
95.6/ 100
METRIC RATING
113th/ 347
METRIC RANK
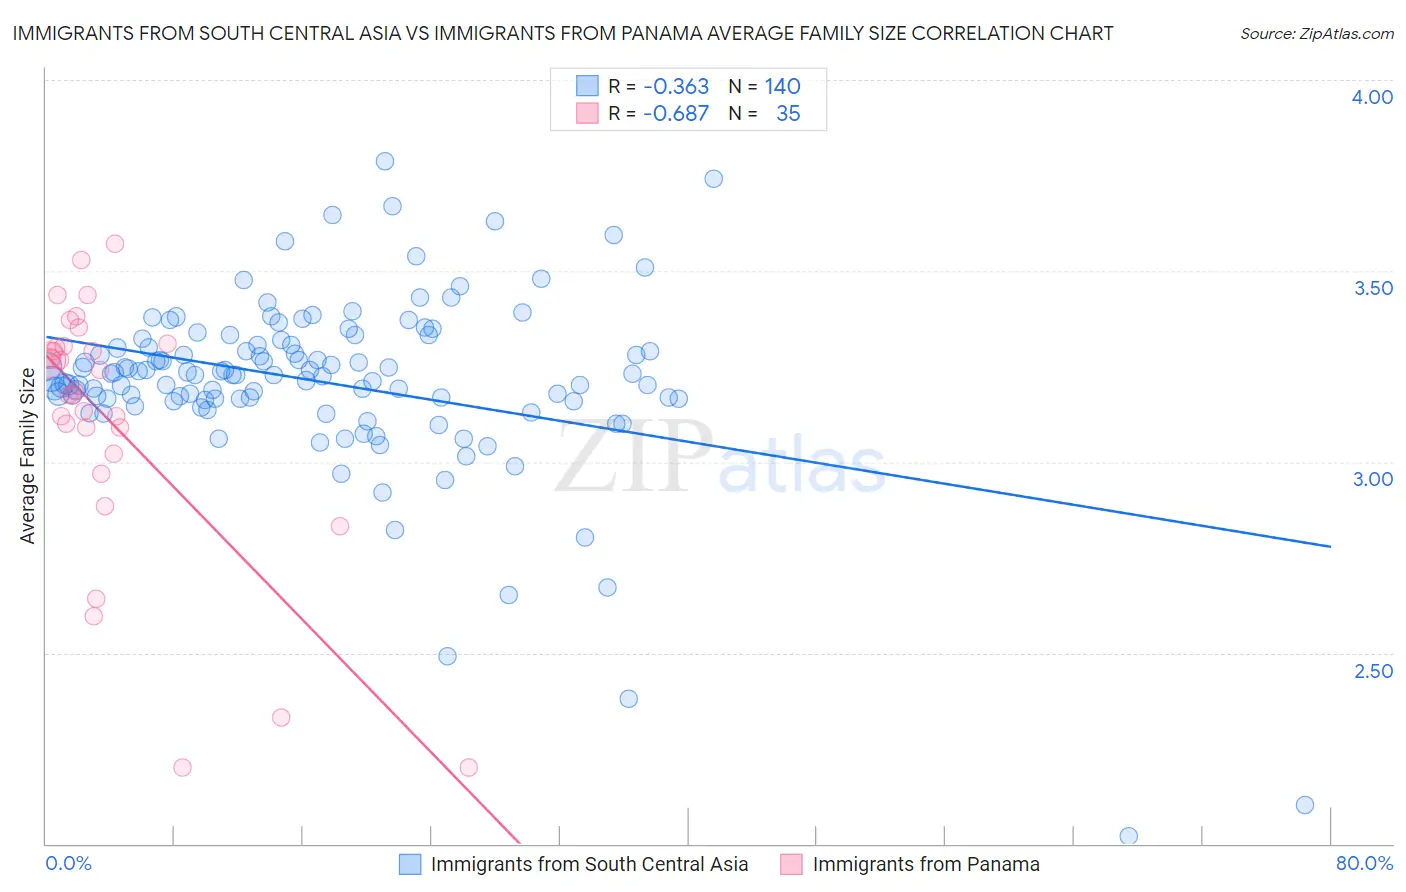
Immigrants from South Central Asia vs Immigrants from Panama Average Family Size Correlation Chart
The statistical analysis conducted on geographies consisting of 472,677,256 people shows a mild negative correlation between the proportion of Immigrants from South Central Asia and average family size in the United States with a correlation coefficient (R) of -0.363 and weighted average of 3.23. Similarly, the statistical analysis conducted on geographies consisting of 221,156,465 people shows a significant negative correlation between the proportion of Immigrants from Panama and average family size in the United States with a correlation coefficient (R) of -0.687 and weighted average of 3.27, a difference of 1.4%.
Average Family Size Correlation Summary
| Measurement | Immigrants from South Central Asia | Immigrants from Panama |
| Minimum | 2.02 | 2.20 |
| Maximum | 3.79 | 3.57 |
| Range | 1.77 | 1.37 |
| Mean | 3.21 | 3.11 |
| Median | 3.23 | 3.18 |
| Interquartile 25% (IQ1) | 3.16 | 3.02 |
| Interquartile 75% (IQ3) | 3.31 | 3.30 |
| Interquartile Range (IQR) | 0.14 | 0.28 |
| Standard Deviation (Sample) | 0.24 | 0.34 |
| Standard Deviation (Population) | 0.24 | 0.34 |
Similar Demographics by Average Family Size
Demographics Similar to Immigrants from South Central Asia by Average Family Size
In terms of average family size, the demographic groups most similar to Immigrants from South Central Asia are Immigrants from China (3.23, a difference of 0.0%), Israeli (3.23, a difference of 0.020%), Immigrants from Uruguay (3.23, a difference of 0.040%), Immigrants from Congo (3.23, a difference of 0.050%), and Argentinean (3.23, a difference of 0.050%).
| Demographics | Rating | Rank | Average Family Size |
| Dutch West Indians | 56.9 /100 | #167 | Average 3.23 |
| Taiwanese | 54.2 /100 | #168 | Average 3.23 |
| Aleuts | 54.1 /100 | #169 | Average 3.23 |
| Arabs | 53.8 /100 | #170 | Average 3.23 |
| Chileans | 53.2 /100 | #171 | Average 3.23 |
| Immigrants | Congo | 52.7 /100 | #172 | Average 3.23 |
| Immigrants | Uruguay | 52.0 /100 | #173 | Average 3.23 |
| Immigrants | South Central Asia | 50.0 /100 | #174 | Average 3.23 |
| Immigrants | China | 49.9 /100 | #175 | Average 3.23 |
| Israelis | 48.7 /100 | #176 | Average 3.23 |
| Argentineans | 47.4 /100 | #177 | Average 3.23 |
| Spaniards | 47.2 /100 | #178 | Average 3.23 |
| Immigrants | Korea | 46.9 /100 | #179 | Average 3.23 |
| Palestinians | 46.6 /100 | #180 | Average 3.23 |
| Spanish | 44.8 /100 | #181 | Average 3.23 |
Demographics Similar to Immigrants from Panama by Average Family Size
In terms of average family size, the demographic groups most similar to Immigrants from Panama are Black/African American (3.27, a difference of 0.010%), South American (3.27, a difference of 0.050%), Immigrants from Liberia (3.27, a difference of 0.060%), Immigrants from South America (3.27, a difference of 0.060%), and Indonesian (3.28, a difference of 0.070%).
| Demographics | Rating | Rank | Average Family Size |
| Paiute | 98.0 /100 | #106 | Exceptional 3.29 |
| Ghanaians | 98.0 /100 | #107 | Exceptional 3.29 |
| Asians | 97.0 /100 | #108 | Exceptional 3.28 |
| Puerto Ricans | 96.7 /100 | #109 | Exceptional 3.28 |
| Bahamians | 96.6 /100 | #110 | Exceptional 3.28 |
| Indonesians | 96.2 /100 | #111 | Exceptional 3.28 |
| Blacks/African Americans | 95.7 /100 | #112 | Exceptional 3.27 |
| Immigrants | Panama | 95.6 /100 | #113 | Exceptional 3.27 |
| South Americans | 95.1 /100 | #114 | Exceptional 3.27 |
| Immigrants | Liberia | 95.0 /100 | #115 | Exceptional 3.27 |
| Immigrants | South America | 95.0 /100 | #116 | Exceptional 3.27 |
| Kiowa | 94.8 /100 | #117 | Exceptional 3.27 |
| Immigrants | Asia | 94.0 /100 | #118 | Exceptional 3.27 |
| Immigrants | Indonesia | 93.7 /100 | #119 | Exceptional 3.27 |
| Immigrants | Bahamas | 93.6 /100 | #120 | Exceptional 3.27 |