Potawatomi vs Immigrants from Southern Europe Single Father Households
COMPARE
Potawatomi
Immigrants from Southern Europe
Single Father Households
Single Father Households Comparison
Potawatomi
Immigrants from Southern Europe
2.5%
SINGLE FATHER HOUSEHOLDS
1.4/ 100
METRIC RATING
256th/ 347
METRIC RANK
2.2%
SINGLE FATHER HOUSEHOLDS
98.6/ 100
METRIC RATING
106th/ 347
METRIC RANK
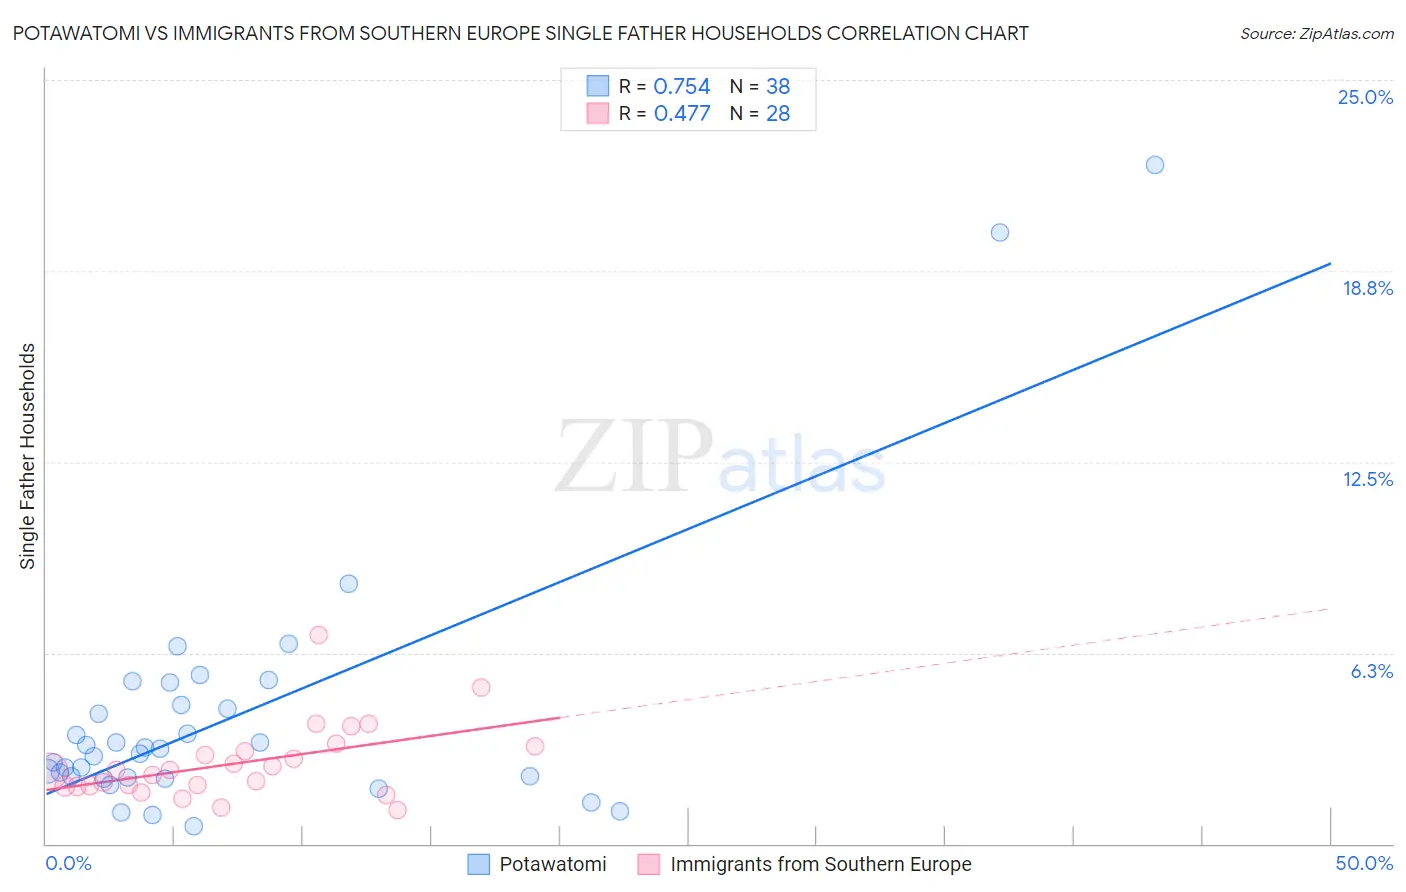
Potawatomi vs Immigrants from Southern Europe Single Father Households Correlation Chart
The statistical analysis conducted on geographies consisting of 117,445,996 people shows a strong positive correlation between the proportion of Potawatomi and percentage of single father households in the United States with a correlation coefficient (R) of 0.754 and weighted average of 2.5%. Similarly, the statistical analysis conducted on geographies consisting of 398,387,388 people shows a moderate positive correlation between the proportion of Immigrants from Southern Europe and percentage of single father households in the United States with a correlation coefficient (R) of 0.477 and weighted average of 2.2%, a difference of 16.9%.
Single Father Households Correlation Summary
| Measurement | Potawatomi | Immigrants from Southern Europe |
| Minimum | 0.58% | 1.1% |
| Maximum | 22.2% | 6.8% |
| Range | 21.6% | 5.7% |
| Mean | 4.2% | 2.6% |
| Median | 3.0% | 2.4% |
| Interquartile 25% (IQ1) | 2.2% | 1.9% |
| Interquartile 75% (IQ3) | 4.5% | 3.1% |
| Interquartile Range (IQR) | 2.4% | 1.2% |
| Standard Deviation (Sample) | 4.4% | 1.2% |
| Standard Deviation (Population) | 4.3% | 1.2% |
Similar Demographics by Single Father Households
Demographics Similar to Potawatomi by Single Father Households
In terms of single father households, the demographic groups most similar to Potawatomi are Tongan (2.5%, a difference of 0.060%), Immigrants from Congo (2.5%, a difference of 0.29%), Spanish (2.5%, a difference of 0.37%), Immigrants from Thailand (2.5%, a difference of 0.47%), and Immigrants from Somalia (2.5%, a difference of 0.51%).
| Demographics | Rating | Rank | Single Father Households |
| Immigrants | Cameroon | 2.3 /100 | #249 | Tragic 2.5% |
| Somalis | 2.1 /100 | #250 | Tragic 2.5% |
| Liberians | 2.0 /100 | #251 | Tragic 2.5% |
| Immigrants | Eritrea | 2.0 /100 | #252 | Tragic 2.5% |
| Immigrants | Somalia | 1.9 /100 | #253 | Tragic 2.5% |
| Immigrants | Thailand | 1.8 /100 | #254 | Tragic 2.5% |
| Tongans | 1.5 /100 | #255 | Tragic 2.5% |
| Potawatomi | 1.4 /100 | #256 | Tragic 2.5% |
| Immigrants | Congo | 1.2 /100 | #257 | Tragic 2.5% |
| Spanish | 1.1 /100 | #258 | Tragic 2.5% |
| Comanche | 1.0 /100 | #259 | Tragic 2.5% |
| Immigrants | Caribbean | 1.0 /100 | #260 | Tragic 2.5% |
| Immigrants | Belize | 0.9 /100 | #261 | Tragic 2.5% |
| Immigrants | Liberia | 0.8 /100 | #262 | Tragic 2.5% |
| Dominicans | 0.8 /100 | #263 | Tragic 2.5% |
Demographics Similar to Immigrants from Southern Europe by Single Father Households
In terms of single father households, the demographic groups most similar to Immigrants from Southern Europe are Palestinian (2.2%, a difference of 0.11%), Slovene (2.2%, a difference of 0.11%), Immigrants from Netherlands (2.2%, a difference of 0.14%), Barbadian (2.2%, a difference of 0.17%), and Italian (2.2%, a difference of 0.30%).
| Demographics | Rating | Rank | Single Father Households |
| South Africans | 99.1 /100 | #99 | Exceptional 2.1% |
| Immigrants | Northern Africa | 99.0 /100 | #100 | Exceptional 2.1% |
| Immigrants | Western Europe | 98.9 /100 | #101 | Exceptional 2.1% |
| Argentineans | 98.9 /100 | #102 | Exceptional 2.1% |
| Lebanese | 98.9 /100 | #103 | Exceptional 2.1% |
| Alsatians | 98.9 /100 | #104 | Exceptional 2.1% |
| Palestinians | 98.6 /100 | #105 | Exceptional 2.2% |
| Immigrants | Southern Europe | 98.6 /100 | #106 | Exceptional 2.2% |
| Slovenes | 98.5 /100 | #107 | Exceptional 2.2% |
| Immigrants | Netherlands | 98.5 /100 | #108 | Exceptional 2.2% |
| Barbadians | 98.4 /100 | #109 | Exceptional 2.2% |
| Italians | 98.3 /100 | #110 | Exceptional 2.2% |
| Immigrants | Canada | 98.3 /100 | #111 | Exceptional 2.2% |
| Immigrants | Trinidad and Tobago | 98.2 /100 | #112 | Exceptional 2.2% |
| Iraqis | 98.2 /100 | #113 | Exceptional 2.2% |