Polish vs Chippewa Divorced or Separated
COMPARE
Polish
Chippewa
Divorced or Separated
Divorced or Separated Comparison
Poles
Chippewa
11.9%
DIVORCED OR SEPARATED
78.6/ 100
METRIC RATING
147th/ 347
METRIC RANK
13.2%
DIVORCED OR SEPARATED
0.0/ 100
METRIC RATING
305th/ 347
METRIC RANK
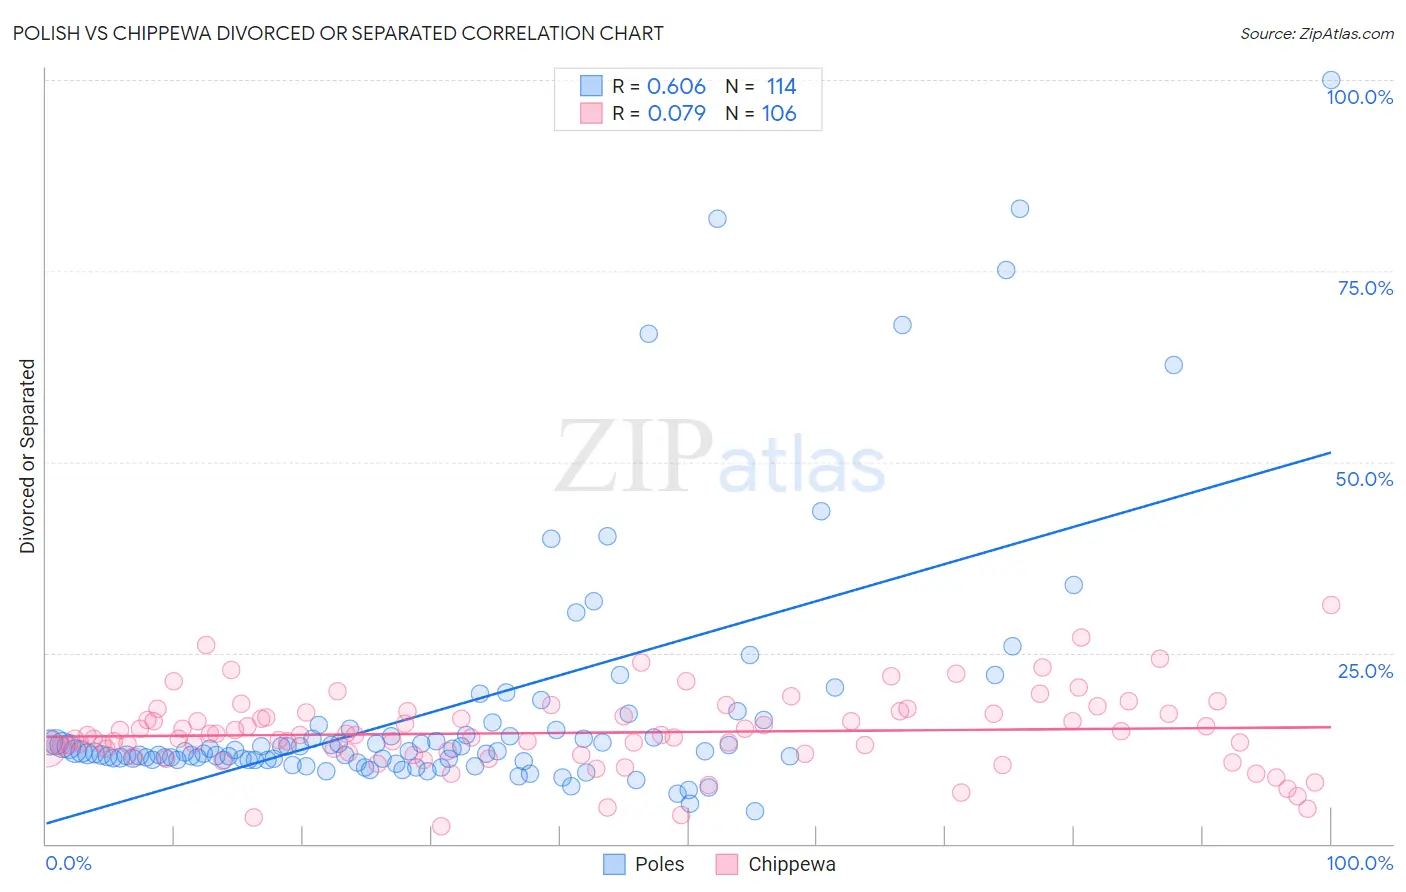
Polish vs Chippewa Divorced or Separated Correlation Chart
The statistical analysis conducted on geographies consisting of 560,123,117 people shows a significant positive correlation between the proportion of Poles and percentage of population currently divorced or separated in the United States with a correlation coefficient (R) of 0.606 and weighted average of 11.9%. Similarly, the statistical analysis conducted on geographies consisting of 215,036,643 people shows a slight positive correlation between the proportion of Chippewa and percentage of population currently divorced or separated in the United States with a correlation coefficient (R) of 0.079 and weighted average of 13.2%, a difference of 10.4%.
Divorced or Separated Correlation Summary
| Measurement | Polish | Chippewa |
| Minimum | 4.3% | 2.3% |
| Maximum | 100.0% | 31.3% |
| Range | 95.7% | 29.0% |
| Mean | 17.6% | 14.5% |
| Median | 12.1% | 14.2% |
| Interquartile 25% (IQ1) | 11.0% | 12.0% |
| Interquartile 75% (IQ3) | 14.3% | 17.1% |
| Interquartile Range (IQR) | 3.2% | 5.1% |
| Standard Deviation (Sample) | 16.8% | 4.9% |
| Standard Deviation (Population) | 16.7% | 4.9% |
Similar Demographics by Divorced or Separated
Demographics Similar to Poles by Divorced or Separated
In terms of divorced or separated, the demographic groups most similar to Poles are Immigrants from Grenada (11.9%, a difference of 0.030%), Italian (11.9%, a difference of 0.040%), Immigrants from Oceania (11.9%, a difference of 0.050%), Immigrants from Portugal (11.9%, a difference of 0.070%), and Croatian (11.9%, a difference of 0.11%).
| Demographics | Rating | Rank | Divorced or Separated |
| Lebanese | 83.4 /100 | #140 | Excellent 11.9% |
| Immigrants | Morocco | 82.9 /100 | #141 | Excellent 11.9% |
| Immigrants | Zimbabwe | 81.5 /100 | #142 | Excellent 11.9% |
| Pakistanis | 81.3 /100 | #143 | Excellent 11.9% |
| Peruvians | 80.9 /100 | #144 | Excellent 11.9% |
| Croatians | 80.6 /100 | #145 | Excellent 11.9% |
| Immigrants | Grenada | 79.1 /100 | #146 | Good 11.9% |
| Poles | 78.6 /100 | #147 | Good 11.9% |
| Italians | 77.8 /100 | #148 | Good 11.9% |
| Immigrants | Oceania | 77.7 /100 | #149 | Good 11.9% |
| Immigrants | Portugal | 77.3 /100 | #150 | Good 11.9% |
| Czechs | 76.4 /100 | #151 | Good 11.9% |
| Immigrants | Hungary | 73.7 /100 | #152 | Good 11.9% |
| Austrians | 72.2 /100 | #153 | Good 12.0% |
| Chileans | 71.3 /100 | #154 | Good 12.0% |
Demographics Similar to Chippewa by Divorced or Separated
In terms of divorced or separated, the demographic groups most similar to Chippewa are Hopi (13.2%, a difference of 0.050%), Tlingit-Haida (13.2%, a difference of 0.16%), Cape Verdean (13.1%, a difference of 0.18%), Immigrants from Venezuela (13.1%, a difference of 0.20%), and Alaskan Athabascan (13.1%, a difference of 0.30%).
| Demographics | Rating | Rank | Divorced or Separated |
| Venezuelans | 0.0 /100 | #298 | Tragic 13.0% |
| Immigrants | Jamaica | 0.0 /100 | #299 | Tragic 13.0% |
| Immigrants | Cabo Verde | 0.0 /100 | #300 | Tragic 13.1% |
| Alaskan Athabascans | 0.0 /100 | #301 | Tragic 13.1% |
| Immigrants | Venezuela | 0.0 /100 | #302 | Tragic 13.1% |
| Cape Verdeans | 0.0 /100 | #303 | Tragic 13.1% |
| Hopi | 0.0 /100 | #304 | Tragic 13.2% |
| Chippewa | 0.0 /100 | #305 | Tragic 13.2% |
| Tlingit-Haida | 0.0 /100 | #306 | Tragic 13.2% |
| French American Indians | 0.0 /100 | #307 | Tragic 13.2% |
| Ottawa | 0.0 /100 | #308 | Tragic 13.2% |
| Americans | 0.0 /100 | #309 | Tragic 13.2% |
| Africans | 0.0 /100 | #310 | Tragic 13.2% |
| Sioux | 0.0 /100 | #311 | Tragic 13.2% |
| Blackfeet | 0.0 /100 | #312 | Tragic 13.3% |