Pennsylvania German vs Jamaican Unemployment Among Ages 25 to 29 years
COMPARE
Pennsylvania German
Jamaican
Unemployment Among Ages 25 to 29 years
Unemployment Among Ages 25 to 29 years Comparison
Pennsylvania Germans
Jamaicans
7.4%
UNEMPLOYMENT AMONG AGES 25 TO 29 YEARS
0.1/ 100
METRIC RATING
267th/ 347
METRIC RANK
7.9%
UNEMPLOYMENT AMONG AGES 25 TO 29 YEARS
0.0/ 100
METRIC RATING
302nd/ 347
METRIC RANK
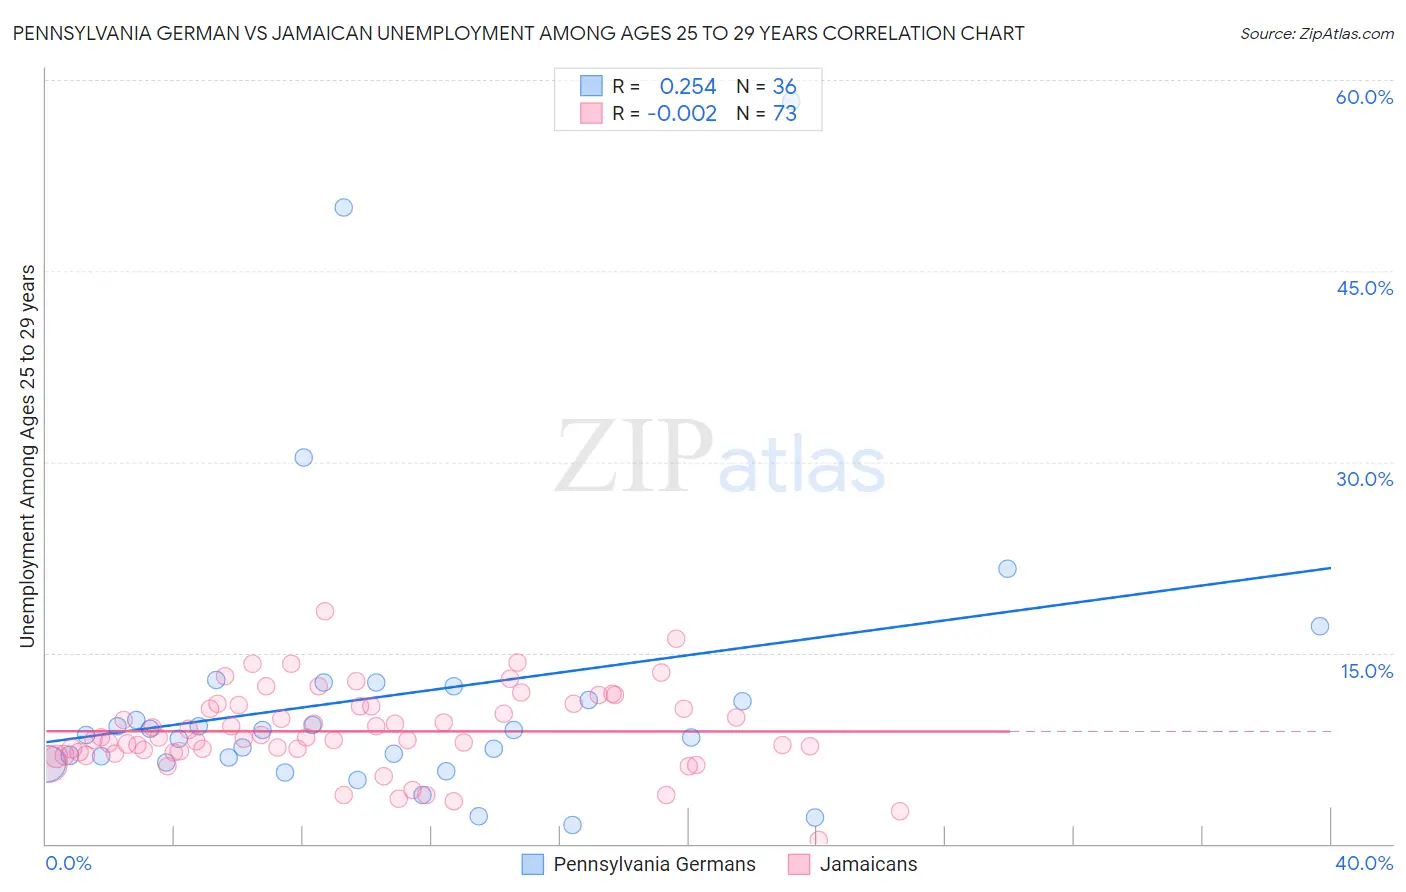
Pennsylvania German vs Jamaican Unemployment Among Ages 25 to 29 years Correlation Chart
The statistical analysis conducted on geographies consisting of 221,850,589 people shows a weak positive correlation between the proportion of Pennsylvania Germans and unemployment rate among population between the ages 25 and 29 in the United States with a correlation coefficient (R) of 0.254 and weighted average of 7.4%. Similarly, the statistical analysis conducted on geographies consisting of 352,650,790 people shows no correlation between the proportion of Jamaicans and unemployment rate among population between the ages 25 and 29 in the United States with a correlation coefficient (R) of -0.002 and weighted average of 7.9%, a difference of 6.8%.
Unemployment Among Ages 25 to 29 years Correlation Summary
| Measurement | Pennsylvania German | Jamaican |
| Minimum | 1.5% | 0.30% |
| Maximum | 58.3% | 18.3% |
| Range | 56.8% | 18.0% |
| Mean | 11.7% | 8.8% |
| Median | 8.7% | 8.3% |
| Interquartile 25% (IQ1) | 6.6% | 7.2% |
| Interquartile 75% (IQ3) | 11.9% | 10.9% |
| Interquartile Range (IQR) | 5.3% | 3.7% |
| Standard Deviation (Sample) | 11.8% | 3.2% |
| Standard Deviation (Population) | 11.6% | 3.2% |
Similar Demographics by Unemployment Among Ages 25 to 29 years
Demographics Similar to Pennsylvania Germans by Unemployment Among Ages 25 to 29 years
In terms of unemployment among ages 25 to 29 years, the demographic groups most similar to Pennsylvania Germans are Immigrants from Ecuador (7.4%, a difference of 0.020%), Paiute (7.4%, a difference of 0.070%), Immigrants from Latin America (7.4%, a difference of 0.080%), Immigrants from Fiji (7.4%, a difference of 0.21%), and Immigrants from Western Africa (7.4%, a difference of 0.27%).
| Demographics | Rating | Rank | Unemployment Among Ages 25 to 29 years |
| Americans | 0.1 /100 | #260 | Tragic 7.4% |
| Nigerians | 0.1 /100 | #261 | Tragic 7.4% |
| Ecuadorians | 0.1 /100 | #262 | Tragic 7.4% |
| Kiowa | 0.1 /100 | #263 | Tragic 7.4% |
| Immigrants | Western Africa | 0.1 /100 | #264 | Tragic 7.4% |
| Immigrants | Fiji | 0.1 /100 | #265 | Tragic 7.4% |
| Paiute | 0.1 /100 | #266 | Tragic 7.4% |
| Pennsylvania Germans | 0.1 /100 | #267 | Tragic 7.4% |
| Immigrants | Ecuador | 0.1 /100 | #268 | Tragic 7.4% |
| Immigrants | Latin America | 0.1 /100 | #269 | Tragic 7.4% |
| Bahamians | 0.0 /100 | #270 | Tragic 7.5% |
| Choctaw | 0.0 /100 | #271 | Tragic 7.5% |
| Immigrants | Bahamas | 0.0 /100 | #272 | Tragic 7.5% |
| Immigrants | Nigeria | 0.0 /100 | #273 | Tragic 7.5% |
| Immigrants | Central America | 0.0 /100 | #274 | Tragic 7.5% |
Demographics Similar to Jamaicans by Unemployment Among Ages 25 to 29 years
In terms of unemployment among ages 25 to 29 years, the demographic groups most similar to Jamaicans are West Indian (7.9%, a difference of 0.16%), Central American Indian (7.9%, a difference of 0.18%), Barbadian (7.9%, a difference of 0.20%), Immigrants from Trinidad and Tobago (7.9%, a difference of 0.38%), and Blackfeet (7.9%, a difference of 0.64%).
| Demographics | Rating | Rank | Unemployment Among Ages 25 to 29 years |
| Comanche | 0.0 /100 | #295 | Tragic 7.8% |
| Immigrants | West Indies | 0.0 /100 | #296 | Tragic 7.8% |
| Blackfeet | 0.0 /100 | #297 | Tragic 7.9% |
| Immigrants | Trinidad and Tobago | 0.0 /100 | #298 | Tragic 7.9% |
| Barbadians | 0.0 /100 | #299 | Tragic 7.9% |
| Central American Indians | 0.0 /100 | #300 | Tragic 7.9% |
| West Indians | 0.0 /100 | #301 | Tragic 7.9% |
| Jamaicans | 0.0 /100 | #302 | Tragic 7.9% |
| Immigrants | Yemen | 0.0 /100 | #303 | Tragic 8.0% |
| Cajuns | 0.0 /100 | #304 | Tragic 8.0% |
| Tsimshian | 0.0 /100 | #305 | Tragic 8.0% |
| Haitians | 0.0 /100 | #306 | Tragic 8.0% |
| Immigrants | Barbados | 0.0 /100 | #307 | Tragic 8.0% |
| Immigrants | Jamaica | 0.0 /100 | #308 | Tragic 8.1% |
| Immigrants | Haiti | 0.0 /100 | #309 | Tragic 8.1% |