Pakistani vs Venezuelan Single Mother Households
COMPARE
Pakistani
Venezuelan
Single Mother Households
Single Mother Households Comparison
Pakistanis
Venezuelans
6.1%
SINGLE MOTHER HOUSEHOLDS
79.2/ 100
METRIC RATING
152nd/ 347
METRIC RANK
6.6%
SINGLE MOTHER HOUSEHOLDS
12.9/ 100
METRIC RATING
201st/ 347
METRIC RANK
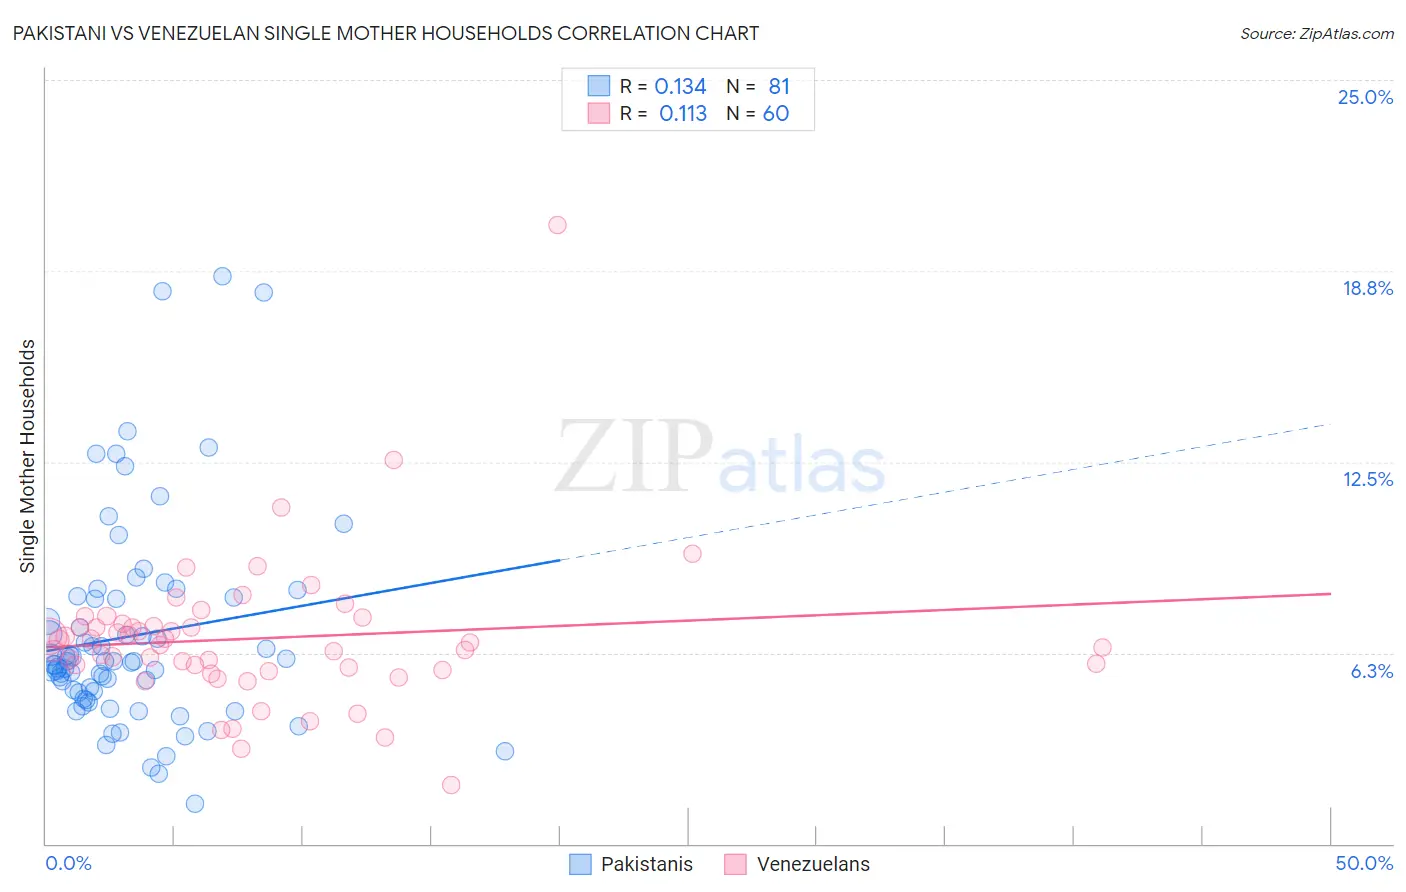
Pakistani vs Venezuelan Single Mother Households Correlation Chart
The statistical analysis conducted on geographies consisting of 334,696,981 people shows a poor positive correlation between the proportion of Pakistanis and percentage of single mother households in the United States with a correlation coefficient (R) of 0.134 and weighted average of 6.1%. Similarly, the statistical analysis conducted on geographies consisting of 305,713,790 people shows a poor positive correlation between the proportion of Venezuelans and percentage of single mother households in the United States with a correlation coefficient (R) of 0.113 and weighted average of 6.6%, a difference of 9.2%.
Single Mother Households Correlation Summary
| Measurement | Pakistani | Venezuelan |
| Minimum | 1.3% | 1.9% |
| Maximum | 18.6% | 20.3% |
| Range | 17.3% | 18.4% |
| Mean | 6.8% | 6.7% |
| Median | 6.0% | 6.6% |
| Interquartile 25% (IQ1) | 4.9% | 5.7% |
| Interquartile 75% (IQ3) | 8.0% | 7.2% |
| Interquartile Range (IQR) | 3.2% | 1.4% |
| Standard Deviation (Sample) | 3.4% | 2.5% |
| Standard Deviation (Population) | 3.4% | 2.5% |
Similar Demographics by Single Mother Households
Demographics Similar to Pakistanis by Single Mother Households
In terms of single mother households, the demographic groups most similar to Pakistanis are Immigrants from Brazil (6.1%, a difference of 0.040%), Immigrants from Philippines (6.1%, a difference of 0.11%), Immigrants from Southern Europe (6.1%, a difference of 0.23%), Zimbabwean (6.1%, a difference of 0.28%), and Immigrants from Albania (6.1%, a difference of 0.42%).
| Demographics | Rating | Rank | Single Mother Households |
| Arabs | 84.0 /100 | #145 | Excellent 6.0% |
| French Canadians | 82.6 /100 | #146 | Excellent 6.0% |
| Immigrants | Jordan | 82.3 /100 | #147 | Excellent 6.0% |
| Scotch-Irish | 82.0 /100 | #148 | Excellent 6.0% |
| Immigrants | Albania | 81.5 /100 | #149 | Excellent 6.1% |
| Zimbabweans | 80.7 /100 | #150 | Excellent 6.1% |
| Immigrants | Southern Europe | 80.5 /100 | #151 | Excellent 6.1% |
| Pakistanis | 79.2 /100 | #152 | Good 6.1% |
| Immigrants | Brazil | 78.9 /100 | #153 | Good 6.1% |
| Immigrants | Philippines | 78.5 /100 | #154 | Good 6.1% |
| Whites/Caucasians | 76.5 /100 | #155 | Good 6.1% |
| Native Hawaiians | 75.0 /100 | #156 | Good 6.1% |
| Chileans | 74.2 /100 | #157 | Good 6.1% |
| Celtics | 73.3 /100 | #158 | Good 6.1% |
| Yugoslavians | 73.1 /100 | #159 | Good 6.1% |
Demographics Similar to Venezuelans by Single Mother Households
In terms of single mother households, the demographic groups most similar to Venezuelans are Guamanian/Chamorro (6.6%, a difference of 0.12%), Immigrants from Peru (6.7%, a difference of 0.21%), Immigrants from Fiji (6.7%, a difference of 0.22%), Cree (6.7%, a difference of 0.24%), and German Russian (6.7%, a difference of 0.32%).
| Demographics | Rating | Rank | Single Mother Households |
| Immigrants | Uganda | 18.3 /100 | #194 | Poor 6.6% |
| South Americans | 18.0 /100 | #195 | Poor 6.6% |
| Uruguayans | 18.0 /100 | #196 | Poor 6.6% |
| Moroccans | 17.4 /100 | #197 | Poor 6.6% |
| Hawaiians | 16.1 /100 | #198 | Poor 6.6% |
| Potawatomi | 15.5 /100 | #199 | Poor 6.6% |
| Immigrants | Ethiopia | 14.7 /100 | #200 | Poor 6.6% |
| Venezuelans | 12.9 /100 | #201 | Poor 6.6% |
| Guamanians/Chamorros | 12.4 /100 | #202 | Poor 6.6% |
| Immigrants | Peru | 12.0 /100 | #203 | Poor 6.7% |
| Immigrants | Fiji | 11.9 /100 | #204 | Poor 6.7% |
| Cree | 11.9 /100 | #205 | Poor 6.7% |
| German Russians | 11.5 /100 | #206 | Poor 6.7% |
| Immigrants | South America | 11.5 /100 | #207 | Poor 6.7% |
| Vietnamese | 11.3 /100 | #208 | Poor 6.7% |